About

Randy Krum infographic designerRandy Krum

President of InfoNewt.
Data Visualization, Infographic Design, Visual Thinking, Product Development and Marketing professional fascinated by good infographics.  Always looking for better ways to get the point across.

Infographic Design


InfoNewt Infographic Design

Search the Cool Infographics site

Custom Search


Subscriptions:


Feedburner

The Cool Infographics Gallery:

How to add the
Cool Infographics button to your:

Cool Infographics iOS icon

- iPhone
- iPad
- iPod Touch


Read on Flipboard for iPad and iPhone

Featured in the Tech & Science category

Flipboard icon

Twitter Feed
Caffeine Poster

The Caffeine Poster infographic

Google Insights

Entries in email (8)

Wednesday
Nov092011

SPAM: More than an Annoyance?

The SPAM: More than an Annoyance? infographic asks the question “Are there actual physical effects of email spam that impact the environment?”  From WebpageFX.com, I like the simple, focused message in this design.

We discovered that a certain amount of Spam emails is actually the equivalent to the level of Green House Gas (GHG) emissions released from driving 3 feet.  Discover how far the number of 2010 spam emails can take you across the world!  You’ll be shocked!  We also highlight the nations most responsible for the furthered adverse impact of Spam’s GHG emissions on our environment.  Our hope is that awareness may create change.  And a great start to doing your part is by personally installing a spam filter on you’re own email account, forwarding spam emails to spam@uce.gov, as well as informing others!

There are a handful of statistics in the infographic that fall into the lazy-designer “large font” style of visualization.  These could have easy been visualized to make the design better.  I do like the shaped clouds to indicate countries and breaking down the different actions related to spam, and relating them to the total carbon footprint.

Although I like the overall design, it is missing some key items.  Data sources?  URL?  WebpageFX’s logo?  License information?

Thanks to Trevin for sending in the link!

Monday
Feb142011

The (visual) Anatomy of an Apple Email


You know how unique Apple emails are when they show up in your Inbox.  The Anatomy of an Apple Email, from Flowtown, does a great job of visually explaining the layout and elements in an infographic with the look and feel of an Apple email.

The emails sent by Apple to consumers are riddled with trademark characteristics, including multiple ‘Calls To Action,’ as well as the beloved ‘Hero Shot.’ Here is a breakdown of each of these characteristics and a summary of their general purpose.

Found on Social Media Graphics

Thursday
Mar252010

What Does Your Email Provider Say About You? [infographic]

From CreditKarma.com, apparently, the email provider you use can imply certain things about your personal financial position to the world.

You may have kept your AOL account since receiving a free disc in the 90’s, signed up for Yahoo! in college, got a Gmail invite, or moved to Comcast when you finally installed broadband, but what does it say about you? When categorized by email provider, the credit score and debt averages of users begins to tell a story. Do Gmail users take on larger mortgages? Do Yahoo! users have lower credit card limits? Credit Karma takes a closer look at how users of the most popular email providers stack up.

Found on FlowingData

Saturday
Oct242009

Subscribe to Cool Infographics by Email


Enter your email address:

Delivered by FeedBurner

Until this week, no one had ever asked to subscribe to Cool Infographics by email. I assumed everyone followed by using an RSS reader, came to the blog site or was following me on Twitter.

This week, Michael asked, so I have now turned on email subscriptions through FeedBurner.  If you would like to receive each new post as an email, just enter your email address above.

Wednesday
Feb042009

One Month of Spam


From TimGraham.net, Tim plotted out some statistics about all of the spam email he received in February 2008. 

Tim, only 208.5 spam emails a day?  You need to get your email address out into more public places!

Thanks for the link Alwyn!

Wednesday
Mar262008

21 Ways to Visualize Your Email Inbox


FlowingData.com has an entry on the 21 Ways to Visualize and Explore Your Email Inbox, which has some really cool visualizations.

Found on SimpleComplexity.net, thanks guys. I hadn't come across FlowingData.com before.

Saturday
Feb022008

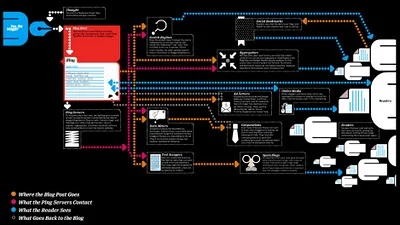
The Life Cycle of a Blog Post


Wired magazine has this infographic flow chart of what happens after someone posts on their blog. From aggregators to text scrapers, your posts live a life of their own on the Internet.

You click Publish and lean back to admire your work. Imperceptibly and all but instantaneously, your post slips into a vast and recursive network of software agents, where it is crawled, indexed, mined, scraped, republished, and propagated throughout the Web.
It's on their multimedia section of the website, but the only multimedia aspect it has is zoom, which is a little disappointing.

Thanks Oliver for sending me the link!

Sunday
Aug262007

E-mail Analysis


Origianally from a NYTimes.com article in 2005, I found reference to this recently on Adam Smith, Esq. (A free registration to NYTimes.com is required to view the full size image)

Some Computer Science professors analyzed one week of e-mail traffic from Enron (about 500,000 emails) in May 2001 looking for patterns that would help investigators narrow down their search. This infographic is the result showing the email connections between employees