Home
Infographics
Book
Tools
Tools Directory
DataViz Guides
DataViz Shows
Word Clouds
Sankey Diagrams
Online Infographics Design
Online DataViz
Analytics Platforms
Infographic Resumes
Vector Graphics
Icon Libraries
Color Pickers
Presentation Design
JavaScript Charts
Free Stock Images
Jobs
Posters
Links
Appearances
About
Contact
Follow Cool Infographics
Need Infographics?
Randy Krum
Designer | Author | Instructor | Speaker
FREE Sample Chapter
Read More
All tagged
cars
Mar
4
Mar 4
Planes, Trains & Automobiles of U.S. Presidents
Randy Krum
Feb
17
Feb 17
A Year of Driving 2016
Randy Krum
Jun
22
Jun 22
Venn Diagram shows Tesla-SolarCity-SpaceX overlap
Randy Krum
May
11
May 11
History of the Batmobile
Randy Krum
Jan
27
Jan 27
2012 Statistics: Pennsylvania Crashes
Randy Krum
Nov
3
Nov 3
Filmography Print Series Posters
Randy Krum
Jun
4
Jun 4
How to Buy a Used Car: 12 Things You Didn’t Know About Car Buying
Randy Krum
Jan
13
Jan 13
What Does the Colour of Your Car Say About You?
Randy Krum
Oct
21
Oct 21
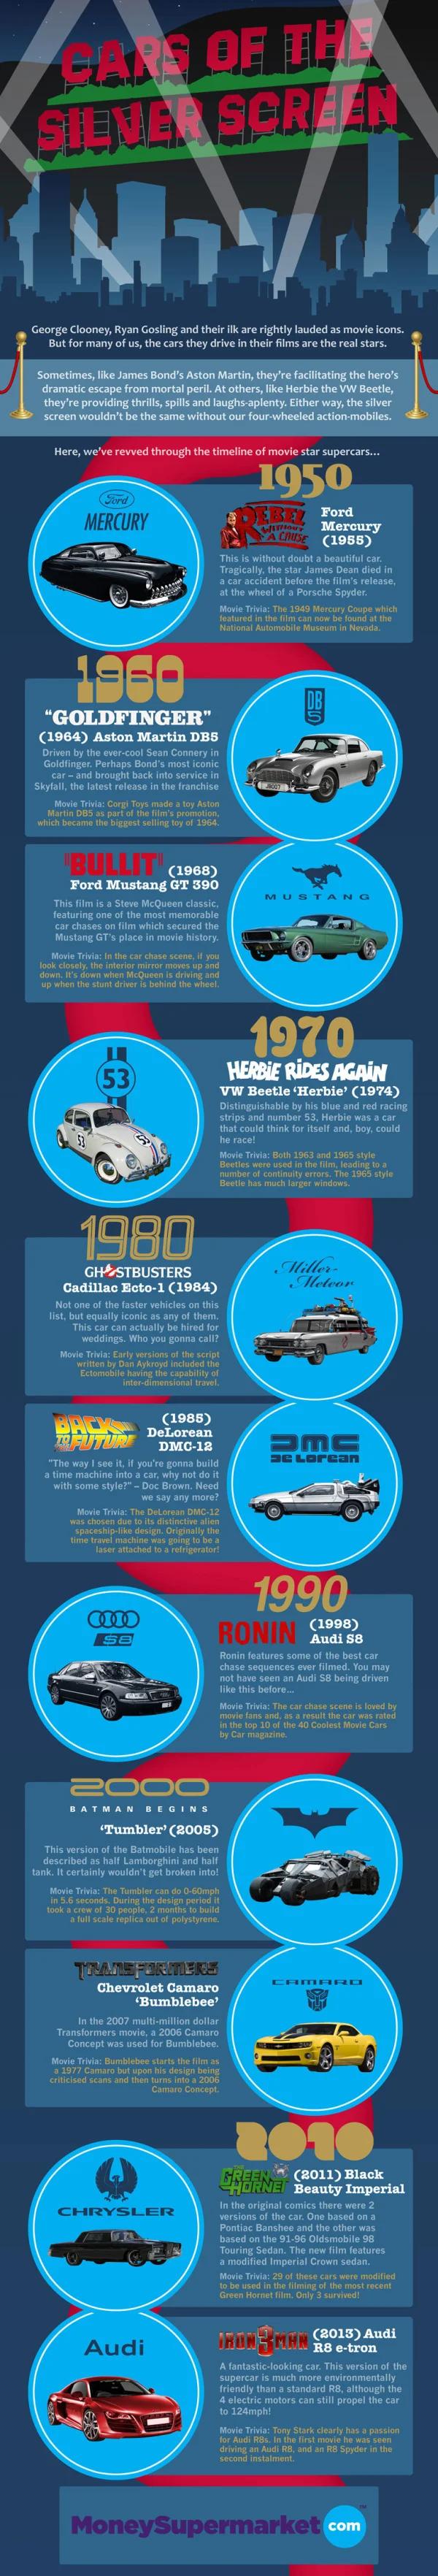
Cars of the Silver Screen
Randy Krum
Jun
6
Jun 6
Most Reliable Cars
Randy Krum
Nov
30
Nov 30
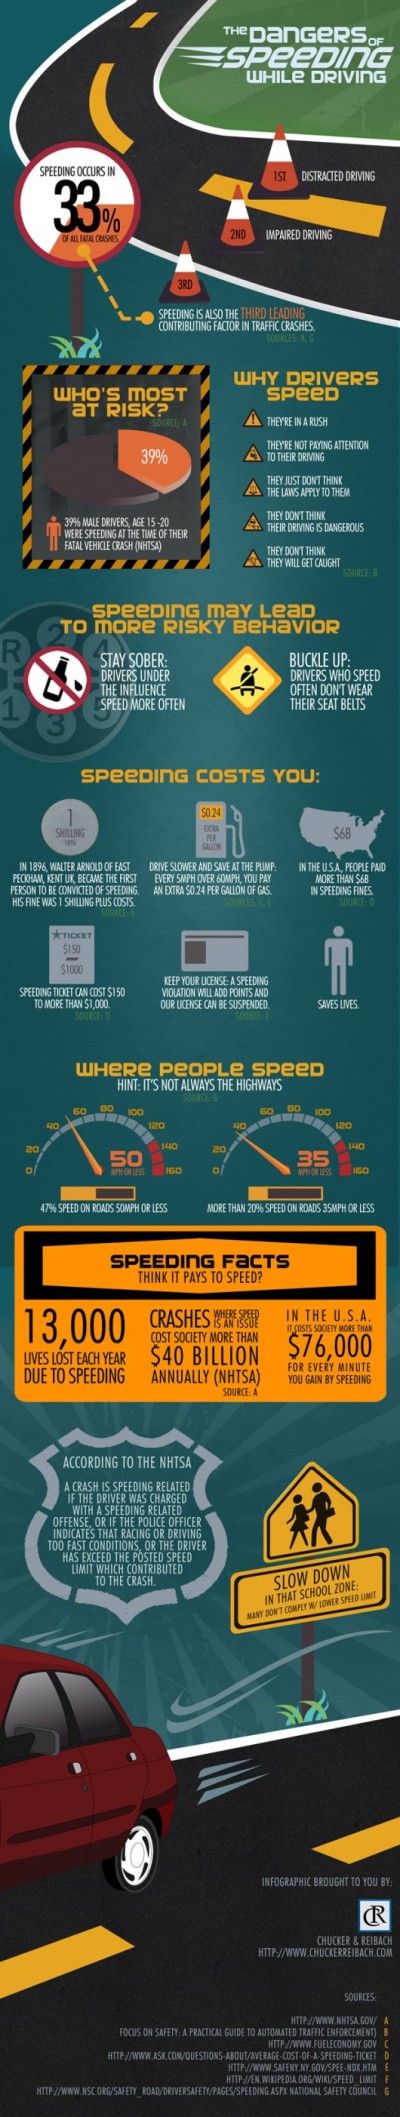
The Dangers of Speeding While Driving
Randy Krum