2012 Statistics: Pennsylvania Crashes
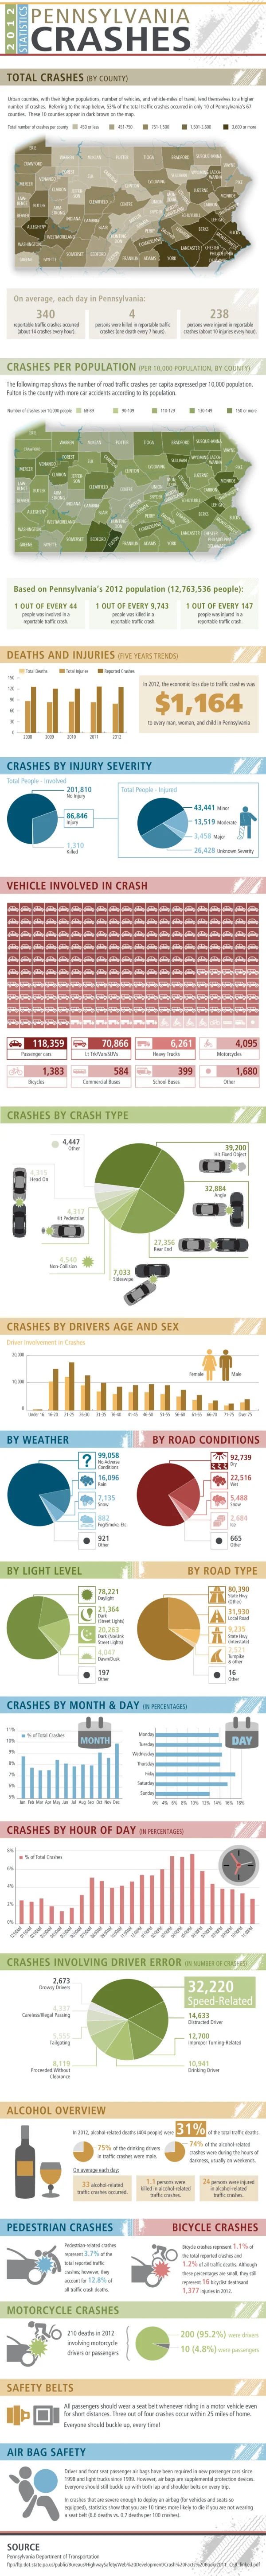
This infographic is a very detailed look into the 2012 Statistics of Pennsylvania Crashes. Solnick & Levin, a law firm that works on cases of personal injury due to accidents, released the infographic to help potential clients understand where their case may fall in the overall state statistics.
The charts and visualizations in this infographic design are clear and very easy for the readers to understand.
However, I frequently talk about the differences between showing statistics with a data visualization versus showing them in text-alone. This is a great example, where some stats are visualized where others are not. Any of the stats shown as only text are generally considered to be secondary information by the readers because they weren’t important enough for the designer to spend the time to visualize.
My recommendation is that you should carefully choose to only include the important statistics that support the overall story in any particular infographic design. If a data point makes the cut and is picked to be included, the designer should take the time to visualize it to make it more easily understood by the readers.
Thanks to James for sending in the link!