Infographics Are Evolving into Many Formats
The internet is full of noise, and your job is to break through that wall of information with something that resonates with your target audience. When you are communicating any message, you want to ensure that your audience will understand and remember the valuable takeaways about your products or services. You want your communication to be clear and concise. This is where infographics come in.
Infographics are your opportunity to convey complex ideas and information in a simple and easily digestible manner. Simply put, our brains love visual information. Infographics can make your marketing and advertising stand out in the crowded world of visual content.
As the Internet, our computing devices and out screen sizes continue to evolve and change, infographics need to evolve as well. Moving past the original static images, infographic storytelling with data visualizations and illustrations can now be found in a number of different formats.
Below, are great examples of different ways to leverage the five different types of infographics to make your product or services more memorable.
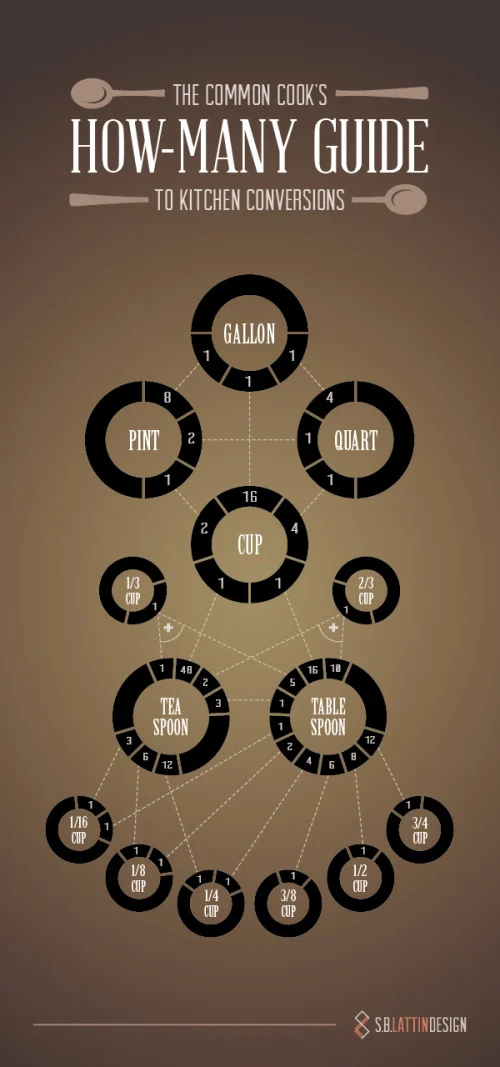
1. Static Infographics - Kitchen Conversion Guide
Static infographics are the most simple and most common infographic format out there. They are usually saved as an image file to be easily distributed and consumed (JPG or PNG format). Static infographics are easily shared using email and social media since there are no moving parts to consider.
Source: https://shannon-lattin.squarespace.com/how-many-guide/
This type of infographic is also easily split up into segments in order to focus on one piece at a time. This is ideal for giving presentations or sharing on social media.
2. Interactive Infographics - Daily Dose of Water
Interactive infographics are great to utilize when you want people to move beyond simply looking at the information. Ideally your audience should get intimate with the facts you’re presenting by following a specific storyline told through your data. By giving your audience something to interact with, they are engaging more of their attention with the data, and will become more immersed in the information.
For example, this infographic from Good.is and Levi’s walks users through their typical routine and calculates how much water is used for each task. This allows a personalized experience for each person that views the infographic, creating a stronger connection to the information being shared.
Source: http://awesome.good.is/transparency/web/1204/your-daily-dose-of-water/flash.html
3. Video Infographics - The Fallen of WWII
Video infographics have been gaining popularity over the years in part for a lot of the same reasons static infographics work: the ease of sharing and the ability to embed it almost anywhere.
In this video infographic that has recently gone viral, the creator uses data visualization to make a powerful statement about the sacrifice soldiers made during World War II. Data visualization is used in such a way to show the stark juxtaposition between the Second World War and more modern conflicts. Check out this quick motion graphic titled, The Fallen of World War II from Austin-based developer Neil Halloran. His use of sound and motion brings the information to life.
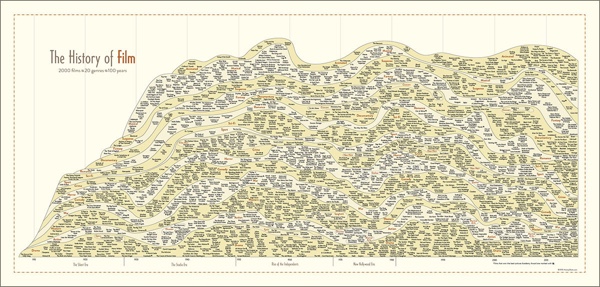
4. Zooming Infographics - The History of Film
Some infographic topics tackle a large amount of information, and a larger design is required to display all of its information. This infographic from Historyshots is a great example of a zooming infographic:
Source: http://www.historyshots.com/products/history-of-film
The History of Film plots out the most important films of the last 100 years into a beautiful, flowing timeline that visually separates the films into 20 different genres. As can be seen above, if this infographic was just left as a static image, it would be difficult to read everything because it is so detailed and complex. In the web browser, a large design is reduced in size so that the entire design can be viewed all at once on the screen, and the zooming controls are made available to the reader to view the small details clearly.
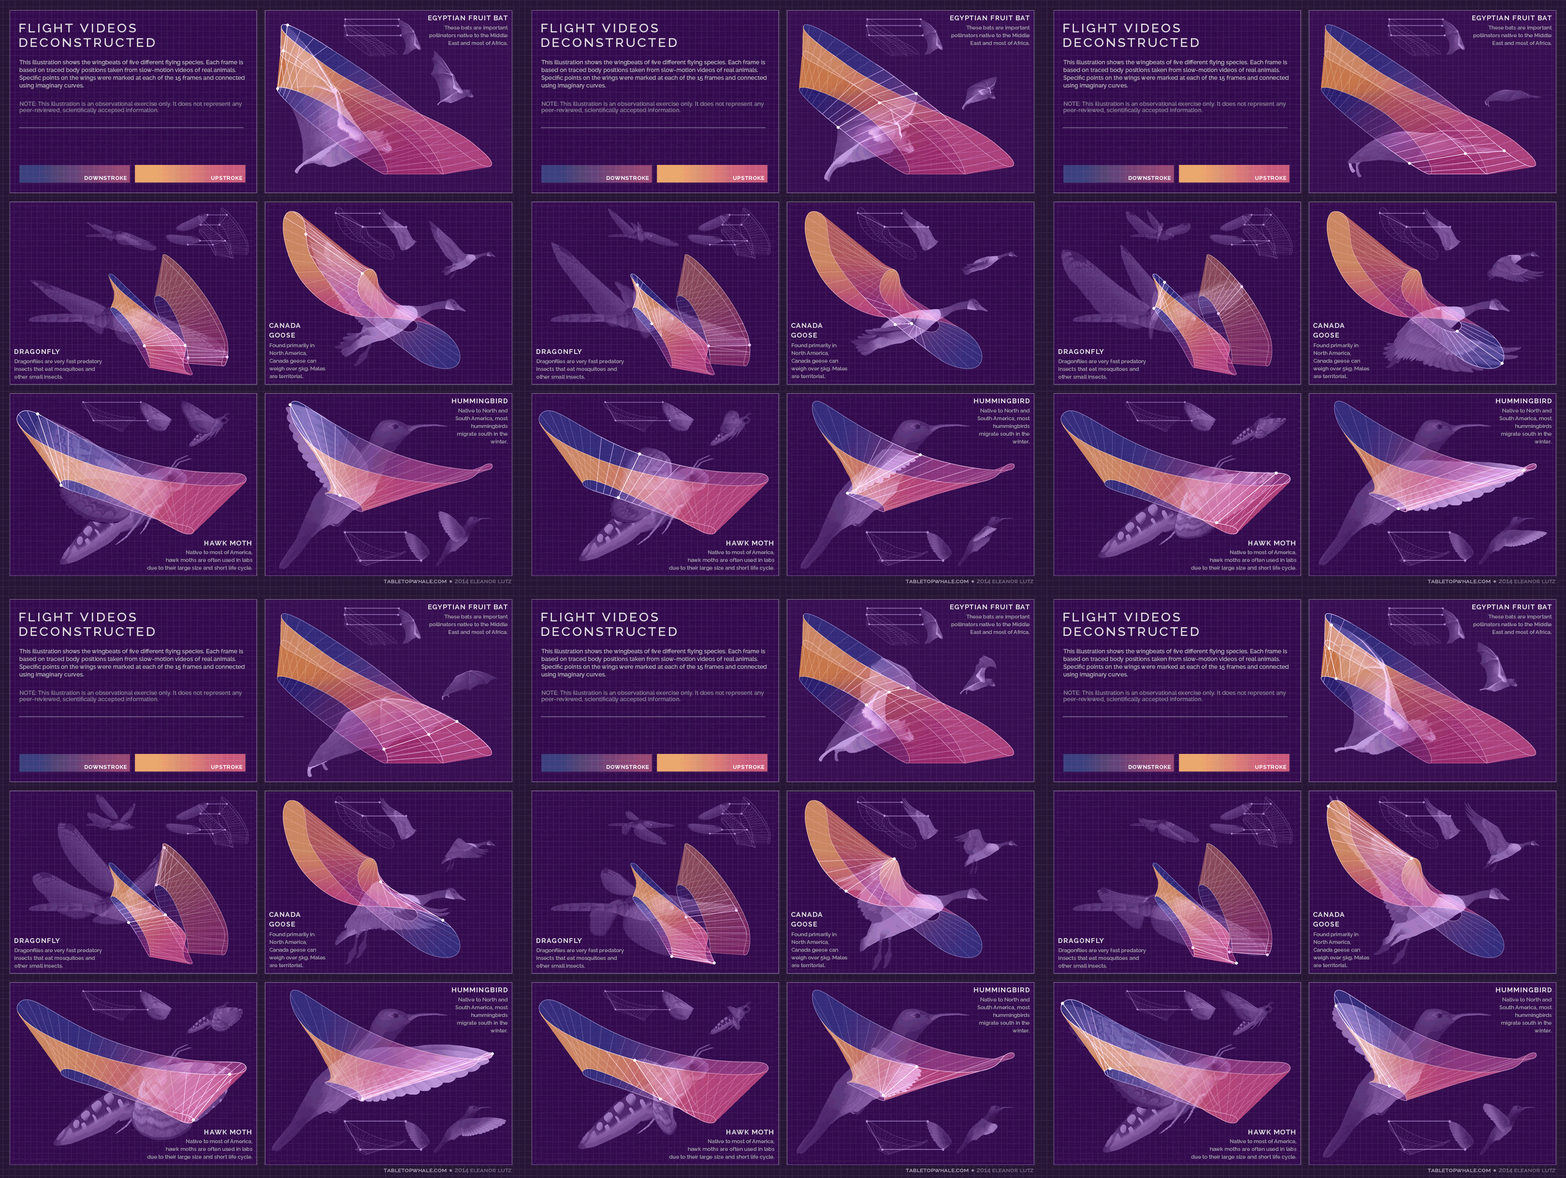
5. Animated Infographics - Flight Videos Deconstructed
Some topics for infographics are best created to feature motion, none more so than one that shows the the flight patterns of an Egyptian Fruit Bat, Dragonfly, Canada Goose, Hawk Moth, and Hummingbird. Flight Videos Deconstructed is an animated infographic about flight patterns within the animal kingdom. Covering five winged animals the and the motion their wings use while taking flight, this animated graphic uses vibrant colors and geometric shapes to convey the beauty and simplicity of flight.
Animated infographics create some motion or change in the design as the reader watches. It might be the bars in a bar chart growing, a color change, or (in the case of these winged animals) an animated character. These are differentiated from the video infographics because these are not video files. These are animated with HTML code or an animated GIF image file format to create the animation but can exist as a stand-alone object on a web page.
Source: http://tabletopwhale.com/2014/09/29/flight-videos-deconstructed.html
With so many new and different formats of infographics available to today’s marketers, providing your audience with a story that conveys your message has never been more exciting. Sharing the key takeaways from your product or services can be done in an expertly designed way that appeals to your audience and leaves them wanting more.


