Home
Infographics
Book
Tools
Tools Directory
DataViz Guides
DataViz Shows
Word Clouds
Sankey Diagrams
Online Infographics Design
Online DataViz
Analytics Platforms
Infographic Resumes
Vector Graphics
Icon Libraries
Color Pickers
Presentation Design
JavaScript Charts
Free Stock Images
Jobs
Posters
Links
Appearances
About
Contact
Follow Cool Infographics
Need Infographics?
Randy Krum
Designer | Author | Instructor | Speaker
FREE Sample Chapter
Read More
All tagged
zoom
Jun
15
Jun 15
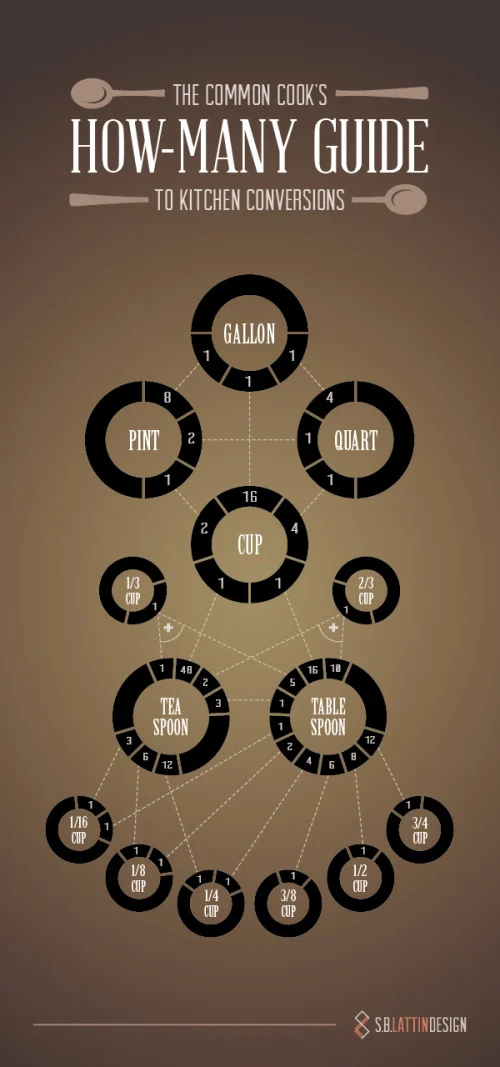
Infographics Are Evolving into Many Formats
Randy Krum
Sep
3
Sep 3
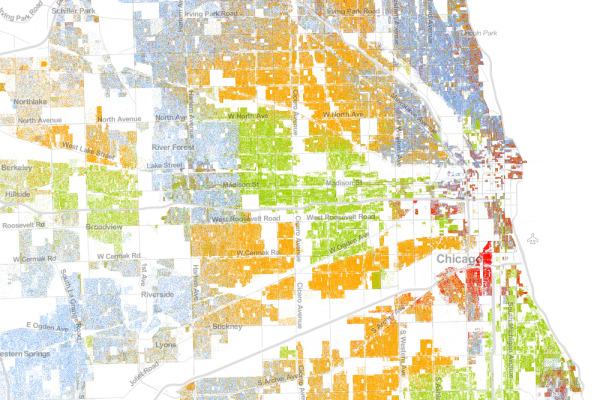
The Racial Dot Map
Randy Krum
Mar
13
Mar 13
Beautiful Animated Wind Maps
Randy Krum
Jan
6
Jan 6
The 2010 Year in Review #infographic
Randy Krum
Jun
24
Jun 24
Adobe Actionscript 3.0 Poster Viewer
Randy Krum