About

Randy Krum

President of InfoNewt.
Data Visualization, Infographic Design, Visual Thinking, Product Development and Marketing professional fascinated by good infographics.  Always looking for better ways to get the point across.


Like us on Facebook to help spread the word!

Click +1 to give us your stamp of approval or just to say “this is pretty cool.”

Infographic Design


Search the Cool Infographics site

Custom Search

Subscriptions:


How to add the
Cool Infographics button to your:

- iPhone
- iPad
- iPod Touch


Read on Flipboard for iPad and iPhone

Featured in the Tech & Science category

The Cool Infographics Gallery on Pinterest

Follow Me!


Follow Randy (@rtkrum) 

Blog posts ONLY on Twitter

Twitter List: Cool Infographics People

Follow Me on Pinterest

Twitter Feed
Caffeine Poster

Gadget Map

Google Insights

« Taking Apart the $819B Stimulus Package | Main | Space Debris image »
Tuesday
Feb242009

Space Debris video


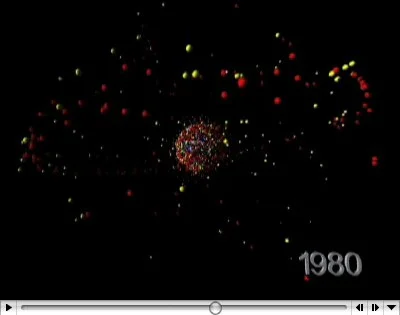
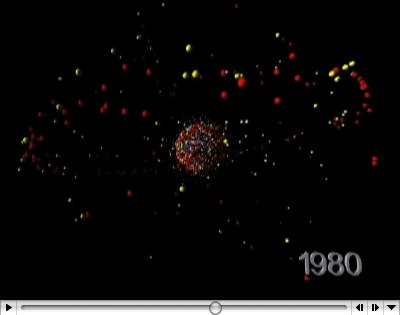
Sticking with the Space Debris theme, the ESA (European Space Agency) has this hi-res video on their website showing how crowded Earth orbit has become from 1968-2000.  Same issue as the image yesterday, that the objects are not to scale.  At this scale you would expect constant collisions, but at actual scale you wouldn't be able to see any objects at all.
In this animation, catalogued space debris are shown accumulating around Earth in 4-year increments, including payloads, rocket bodies, and fragments. While the debris objects are not shown to scale, the representation of their density is accurate.

PrintView Printer Friendly Version

EmailEmail Article to Friend

Reader Comments

There are no comments for this journal entry. To create a new comment, use the form below.

PostPost a New Comment

Enter your information below to add a new comment.

My response is on my own website »
Author Email (optional):
Author URL (optional):
Post:
 
All HTML will be escaped. Hyperlinks will be created for URLs automatically.