About

Randy Krum

President of InfoNewt.
Data Visualization, Infographic Design, Visual Thinking, Product Development and Marketing professional fascinated by good infographics.  Always looking for better ways to get the point across.


Like us on Facebook to help spread the word!

Click +1 to give us your stamp of approval or just to say “this is pretty cool.”

Infographic Design


Search the Cool Infographics site

Custom Search

Subscriptions:


How to add the
Cool Infographics button to your:

- iPhone
- iPad
- iPod Touch


Read on Flipboard for iPad and iPhone

Featured in the Tech & Science category

The Cool Infographics Gallery on Pinterest

Follow Me!


Follow Randy (@rtkrum) 

Blog posts ONLY on Twitter

Twitter List: Cool Infographics People

Follow Me on Pinterest

Twitter Feed
Caffeine Poster

Gadget Map

Google Insights

« Linux Kernel Zoomable Map | Main | The Insipid World of Infographics (infographic) »
Tuesday
May182010

Crude Awakening - Gulf Spill Infographic

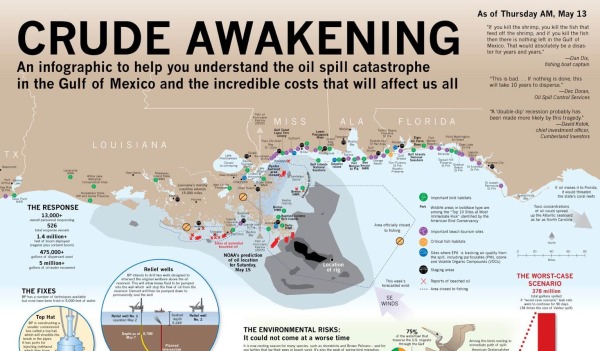
This is a very comprehensive, detail-heavy infographic designed by Carol Zuber-Mallison at ZM Graphics for InfographicsWorld.com.  Including map data, a timeline, a few pie and bar charts, a schematic of the different fix scenarios and a visual of almost 4,000 squares.

“I usually do print work; this is my first piece specifically for social media.  It just kept getting bigger and bigger as things continued to get worse in the Gulf.

I built it in four frantic days.  There’s some things O would have done differently but when you’re working that fast you’re just putting stuff together with prayer and duct tape.  Design takes a back seat to trying to get the information right.

This is an ongoing news event so things are constantly changing and I hope to update it at least once a week.  (If you’ve found an error, please e-mail me so I can fix it.)”

— Carol Zuber-Mallison

Thanks to Justin Beegel from InfographicsWord.com for sending in the link!

PrintView Printer Friendly Version

EmailEmail Article to Friend

Reader Comments (4)

Infographic as a case study in TEOTWAWKI.

May 18, 2010 | Unregistered Commentervanderleun

Very nice map, found some other great info here

June 11, 2010 | Unregistered CommenterAlex

Any chance we can get an updated version now that we're in June and the recent developments/announcements? Thx!

June 18, 2010 | Unregistered CommenterNic
The link has 404'd, so I can't enlarge the infographic. Looks pretty from afar though...
September 16, 2011 | Unregistered CommenterUnconcernedCitizen

PostPost a New Comment

Enter your information below to add a new comment.

My response is on my own website »
Author Email (optional):
Author URL (optional):
Post:
 
All HTML will be escaped. Hyperlinks will be created for URLs automatically.