Home
Infographics
Book
Tools
Tools Directory
DataViz Guides
DataViz Shows
Word Clouds
Sankey Diagrams
Online Infographics Design
Online DataViz
Analytics Platforms
Infographic Resumes
Vector Graphics
Icon Libraries
Color Pickers
Presentation Design
JavaScript Charts
Free Stock Images
Jobs
Posters
Links
Appearances
About
Contact
Follow Cool Infographics
Need Infographics?
Randy Krum
Designer | Author | Instructor | Speaker
FREE Sample Chapter
Read More
All tagged
acquisition
Apr
2
Apr 2
The Enterprise Mobility Ecosystem Map
Randy Krum
Mar
5
Mar 5
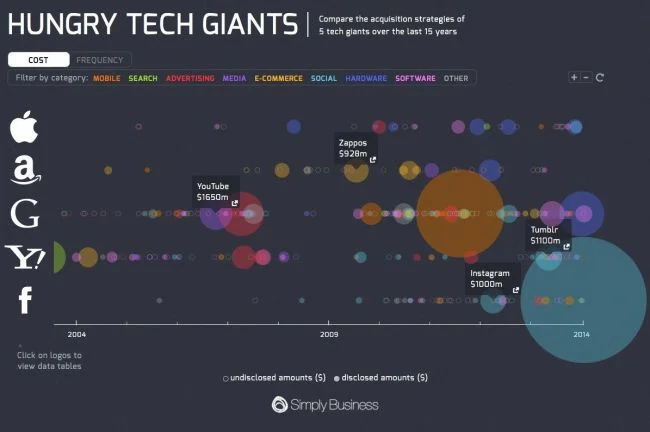
Hungry Tech Giants
Randy Krum
Sep
14
Sep 14
Google in 2011: Courtroom & Boardroom
Randy Krum