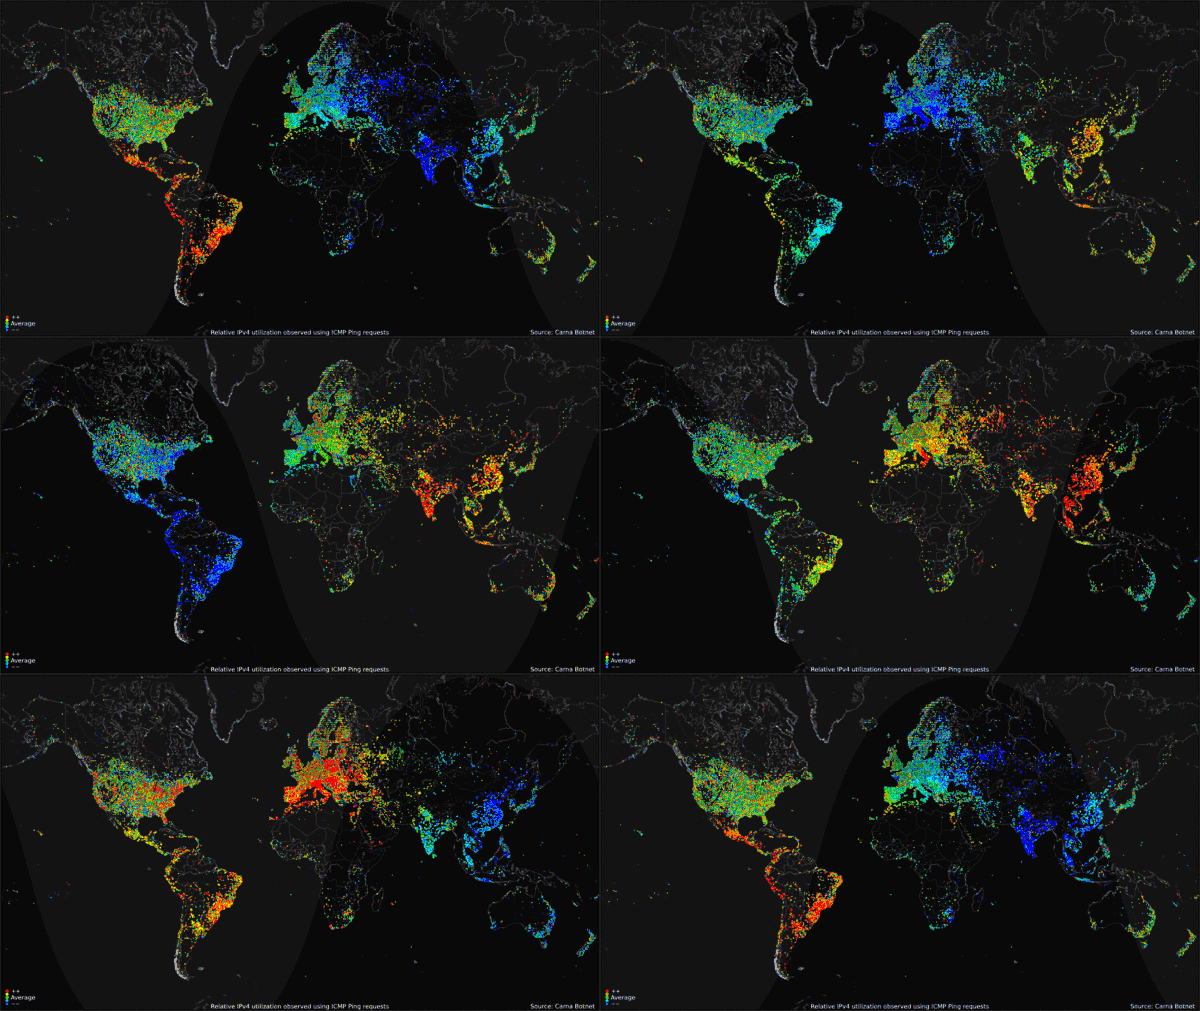
460 Million Connected Internet Devices
Beautiful data visualizations of some very scary data!
An anonymous hacker under the pseudonym of “Carna Botnet” has posted a comprehensive Internet Census 2012 report of over 460 million internet connected devices that responded to PING requests or were found to have open ports. He was able to create a botnet using over 30,000 Internet devices that had remote administration available using the Telenet and still had the factory installed standard passwords. He found several hundred thousand open devices, but didn’t need that many.
Abstract: While playing around with the Nmap Scripting Engine (NSE) we discovered an amazing number of open embedded devices on the Internet. Many of them are based on Linux and allow login to standard BusyBox with empty or default credentials. We used these devices to build a distributed port scanner to scan all IPv4 addresses. These scans include service probes for the most common ports, ICMP ping, reverse DNS and SYN scans. We analyzed some of the data to get an estimation of the IP address usage.
All data gathered during our research is released into the public domain for further study.
The visualizations he was able to create using the gathered data are fantastic. Check out the IMAGES page of the report for beautiful, high-resolution images.
The map visualization above shows the geolocation data of all 460 million devices that responded to the queries from the botnet, clustered around population centers as you might expect. The animated GIF below shows the geolocated devices that responded during the course of a day, showing that many devices are turned off overnight but many more are just left on constantly.
My favorite visualization from the data is the Hilbert Map, which uses the a 2-dimensional Hilbert Curve to map out the continuous sequence of IP4 addresses into a square area, and then color-codes the address blocks that responded to a PING request. There’s even a cool zoomable viewer of the Hilbert Map that lets you drill into the details.
This form of mapping was inspired by the xkcd Map of the Internet, which shows the Internet addresses that were distributed to major corporations in the 1990s before the Regional Internet Registries took over the allocation.
Found on the Security Now podcast #396 and FlowingData


