VISA London Economic Outlook

VISA was smart and jumped on the London band wagon. Designed by Bright Blue Day, the VISA London Economic Outlook infographic from Visa Europe shows a summary of the Olympics impact report.
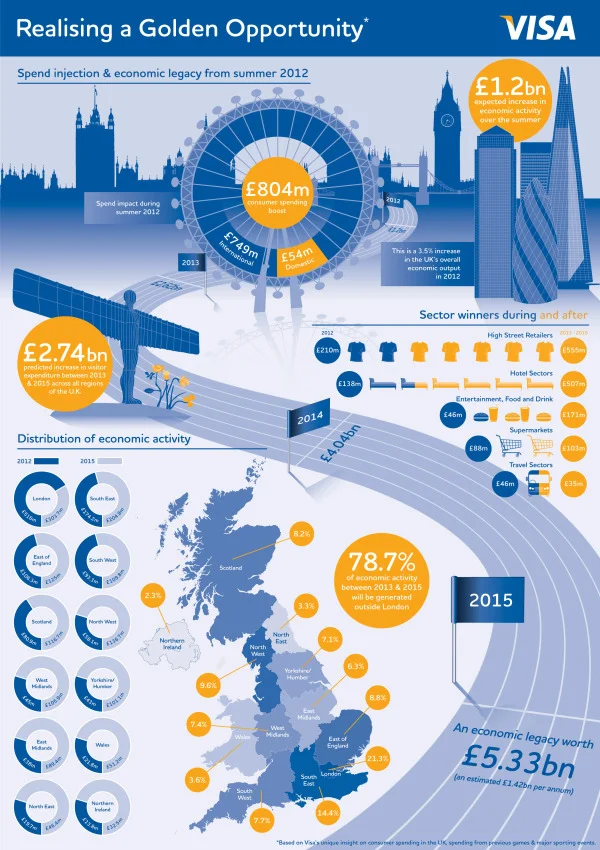
The London 2012 Olympic and Paralympic Games will deliver an £804m consumer spending injection for the UK this summer and an economic legacy worth £5.33bn by 2015, according to Visa’s report, “Realising a Golden Opportunity: Visa Europe’s London 2012 Olympic and Paralympic Games Expenditure and Economic Impact Report”.
The report looks at the consumer expenditure and economic output related to the Games and its distribution across the country. It is based on Visa’s unique insight into consumer spending in the UK and spending data from previous Games and major sporting events.
We have also produced a unique infographic providing an easily-digested visual summary of the report’s findings.
This is a great use of an infographic as an executive summary of a much larger report. This builds awareness, interest and traffic to a report that VISA Europe obviously spent a lot of money to sponsor.
A few thoughts about the infographic design:
The call-out circles surrounding the map of the UK should be sized to match their values.
The doughnut charts don’t work for the Distribution of Economic Activity. The percentages are too close together, so all of the doughnuts look almost the same. I think a pair of bars for each location, but keeping the scale consistent across all locations would have worked much better.
I love the icons for the business sectors
The color scheme is fantastic! Simple, directly tied to VISA and makes the overall design bold without being gaudy.
The monument silhouettes from London are easily recognizable, and work nicely in the background without drawing too much attention.
The bottom should have a clear copyright, and the direct URL link to the original infographic landing page.
They also created a short infographic video based on the static infographic:
The infographic is available as a high-resolution JPG image file or a high-resolution PDF.
The designer at Bright Blue Day was Ollie Flippence. Great job Ollie! Thanks for sending in the link!