About

Randy Krum

President of InfoNewt.
Data Visualization, Infographic Design, Visual Thinking, Product Development and Marketing professional fascinated by good infographics.  Always looking for better ways to get the point across.


Like us on Facebook to help spread the word!

Click +1 to give us your stamp of approval or just to say “this is pretty cool.”

Infographic Design


Search the Cool Infographics site

Custom Search

Subscriptions:


How to add the
Cool Infographics button to your:

- iPhone
- iPad
- iPod Touch


Read on Flipboard for iPad and iPhone

Featured in the Tech & Science category

The Cool Infographics Gallery on Pinterest

Follow Me!


Follow Randy (@rtkrum) 

Blog posts ONLY on Twitter

Twitter List: Cool Infographics People

Follow Me on Pinterest

Twitter Feed
Caffeine Poster

Gadget Map

Google Insights

« Client Infographic: The Good News for Online Degrees | Main | An Infographic Guide to Buying Your Own Island »
Tuesday
Sep212010

Your Coming Tax Cut (or Not)


From the NYTimes.com comes a very clean infographic look at the debate around renewing the U.S. tax cuts.

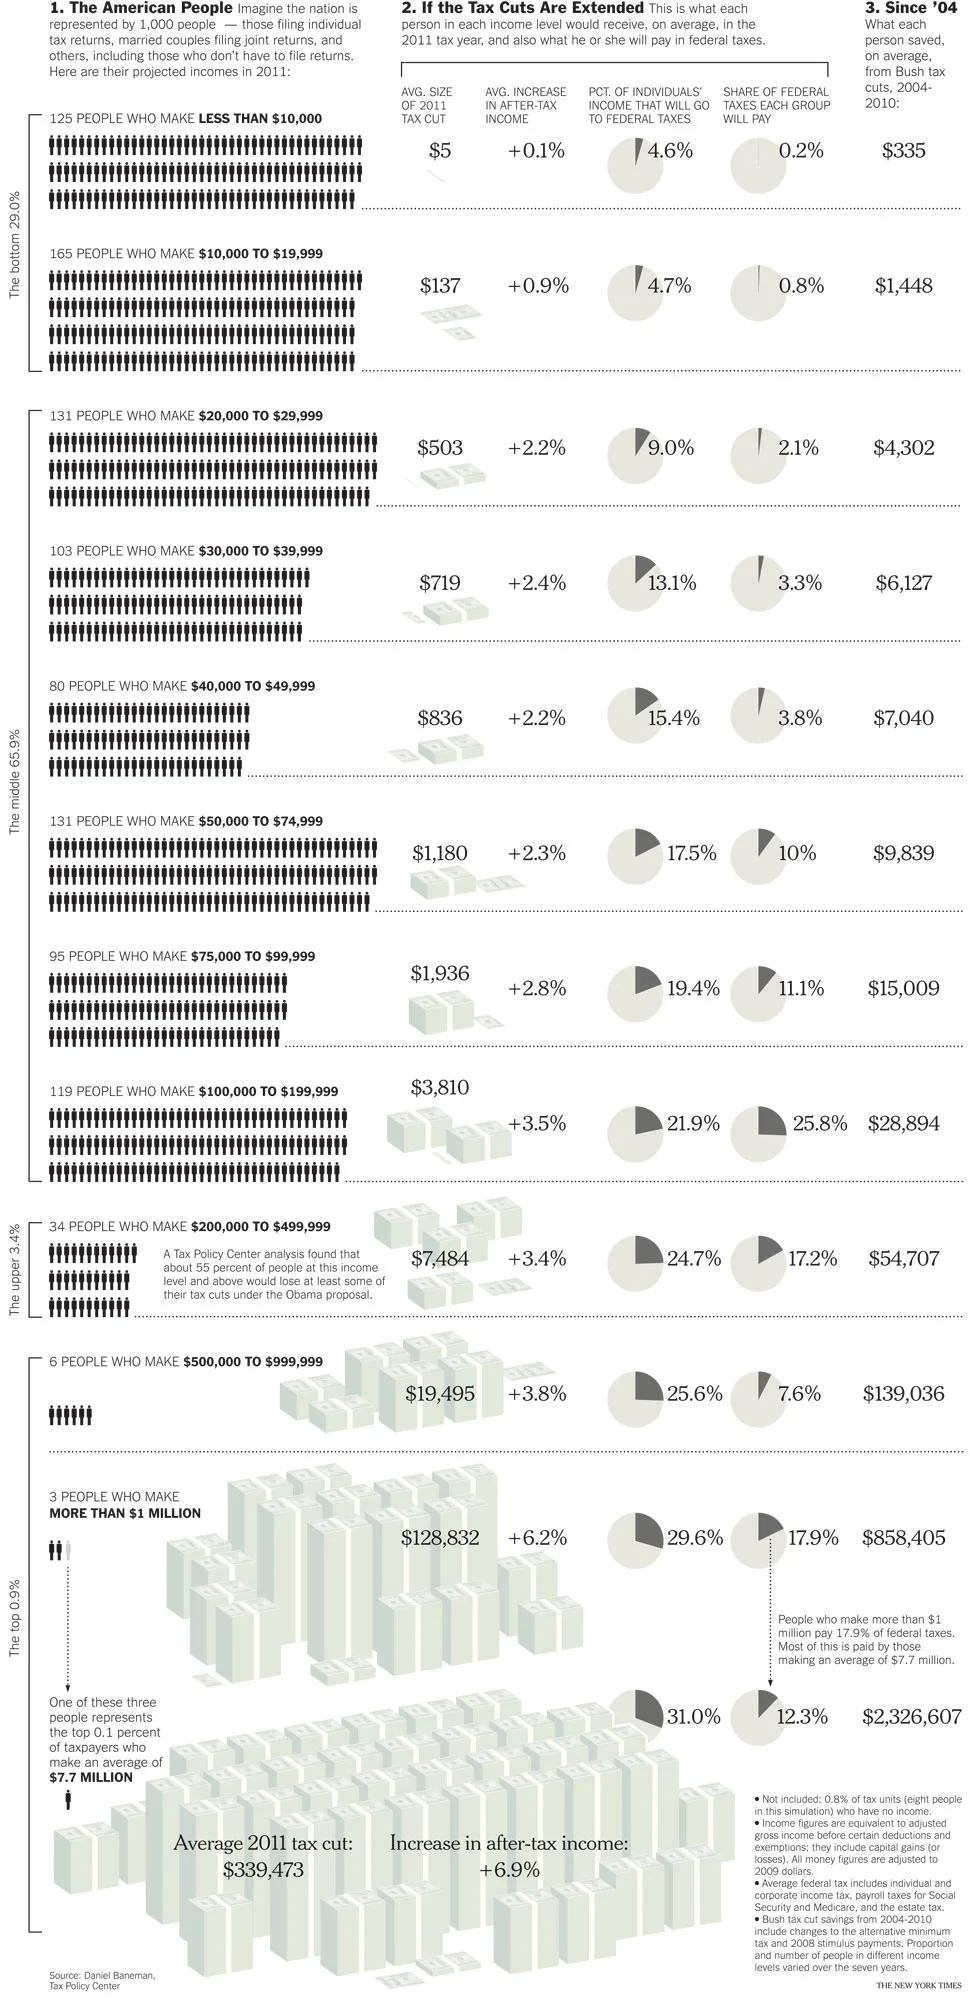
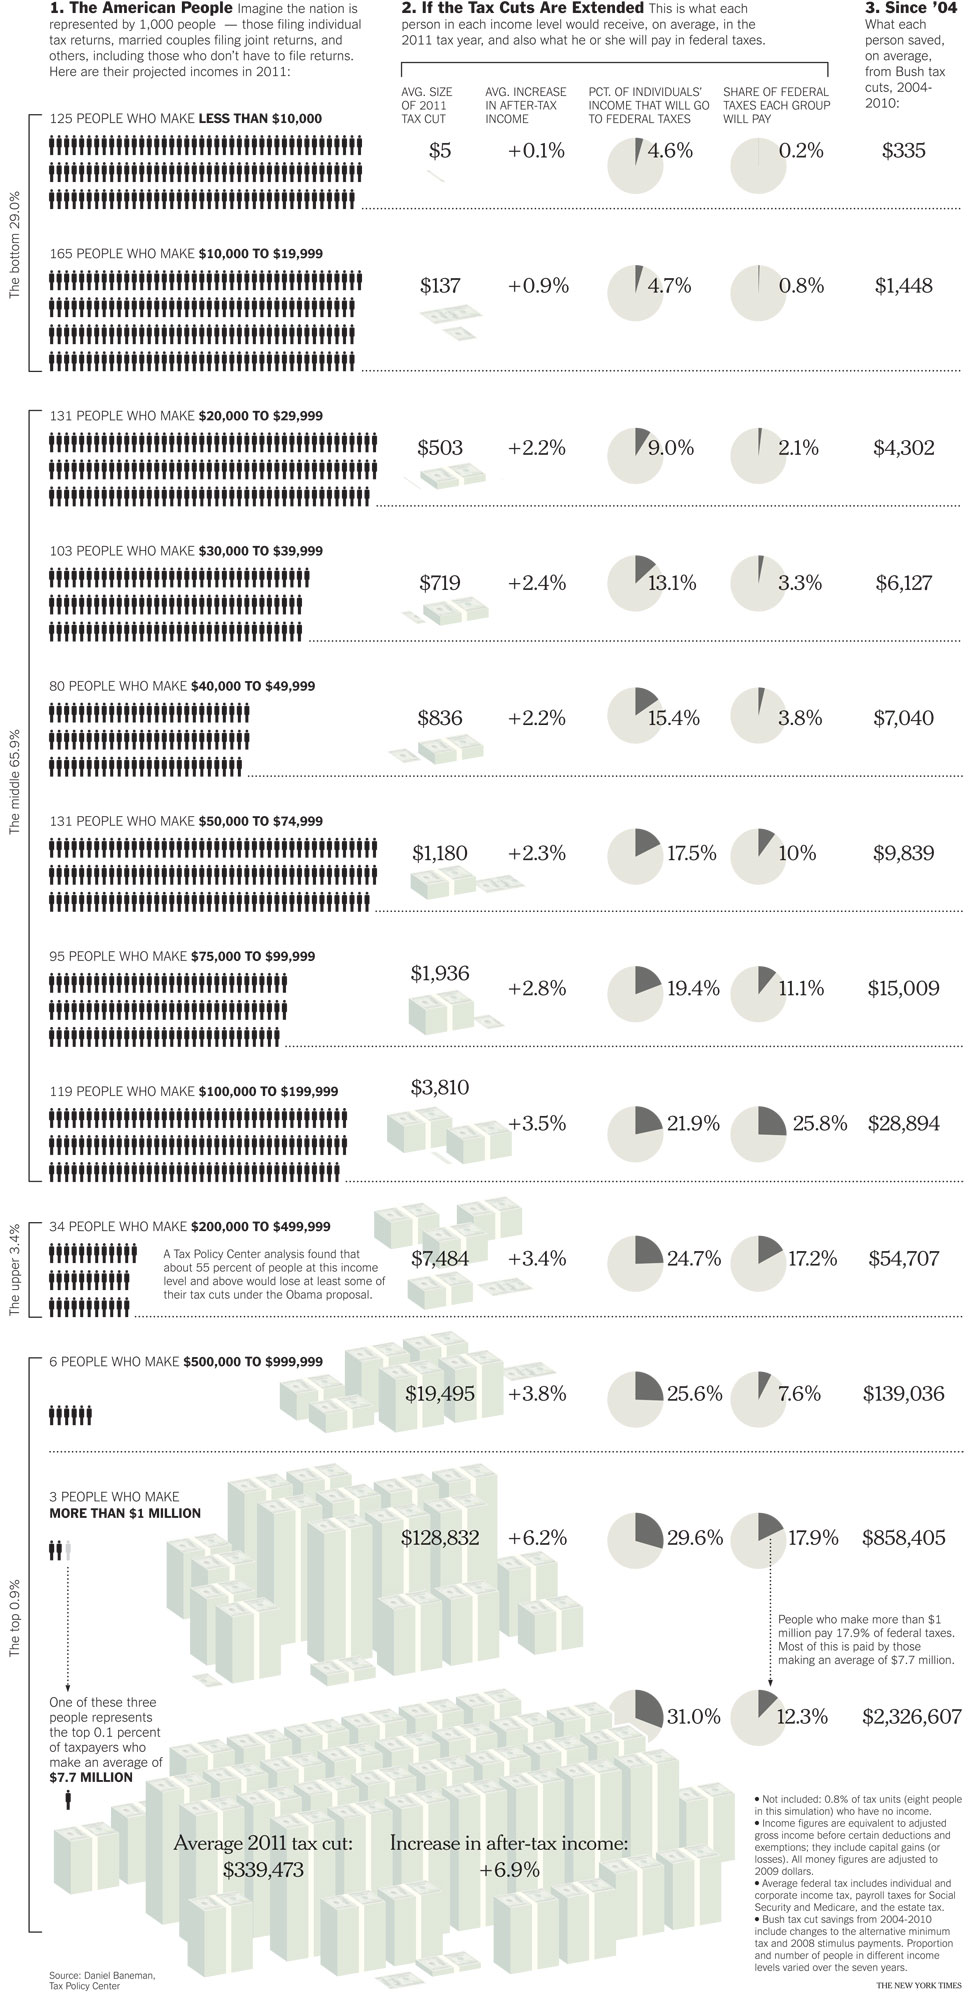
The Bush tax cuts of 2001 and 2003 are set to expire at the end of this year, and the fight is on to renew some or all of them. Many Democrats want to scrap future cuts for the wealthiest taxpayers — individuals whose income after deductions is more than $200,000 and couples at $250,000 or more. The Republican leaders insist that all taxpayers should get relief, even those in the highest income strata. Wealthy Americans, they say, can use their tax savings to create jobs.

In either case, the extensions would be expensive: perhaps $2.7 trillion less for the Treasury through 2020. Here is a guide to who will get what if the cuts are extended, and who got what from the last seven years of cuts, according to an analysis by the Tax Policy Center, a nonpartisan research organization. 

 Found on Chart Porn

PrintView Printer Friendly Version

EmailEmail Article to Friend

Reader Comments (1)

You know what would bhe interesting? Showing how much $ redistribution typically happens via taxes vs if $ left in taxpayers pockets.
September 24, 2010 | Unregistered Commenterd Shea
Comments for this entry have been disabled. Additional comments may not be added to this entry at this time.