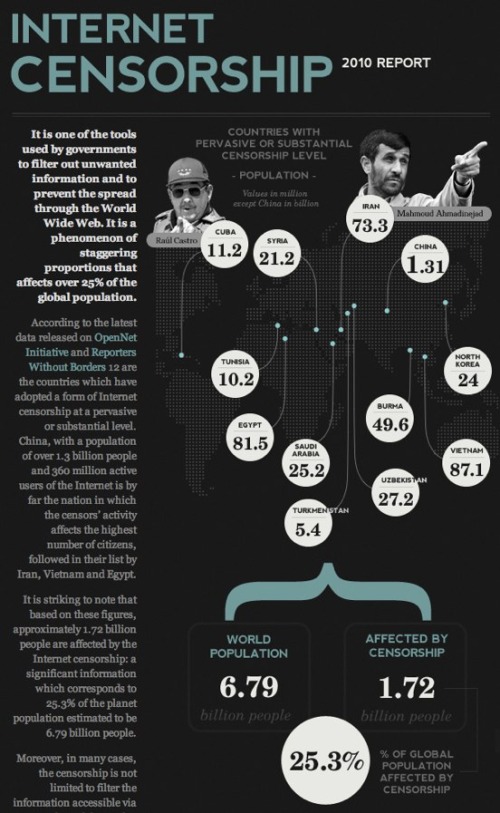
The 2010 Internet Censorship Report infographic
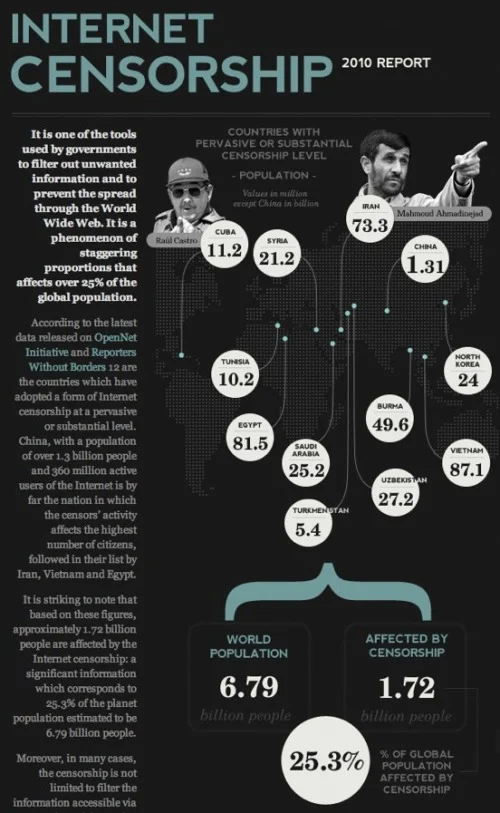

From Antonio Lupetti at WoorkUp.com, The 2010 Internet Censorship Report looks at how many people in the world population are effected by government censorship.
It is one of the tools used by governments to filter out unwanted information and to prevent the spread through the World Wide Web. It is a phenomenon of staggering proportions that affects over 25% of the global population.
My suggestion for improvement is that I think the the white circles representing the countries should be sized in accordance the population numbers.
Thanks to Antonio for sending in the link.


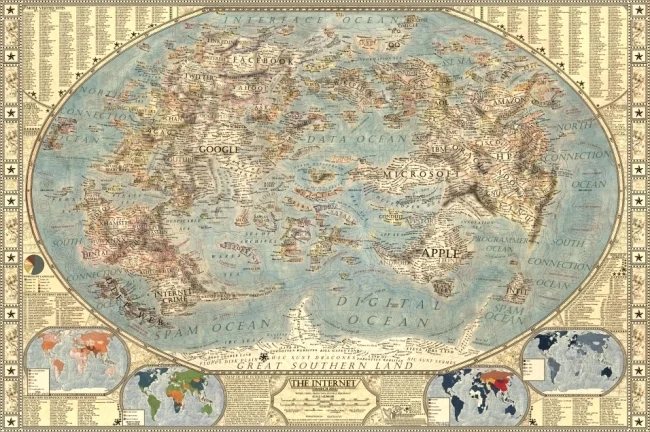
![The State of the Internet [infographic]](https://images.squarespace-cdn.com/content/v1/5bfc8dbab40b9d7dd9054f41/1554169226215-K3HV9DE4NJYQI2IZB15Y/Safari.jpg)