About

Randy Krum

President of InfoNewt.
Data Visualization, Infographic Design, Visual Thinking, Product Development and Marketing professional fascinated by good infographics.  Always looking for better ways to get the point across.


Like us on Facebook to help spread the word!

Click +1 to give us your stamp of approval or just to say “this is pretty cool.”

Infographic Design


Search the Cool Infographics site

Custom Search

Design Contest!

Infographic Design Contest!

Enter to win an iPad 2!

Subscriptions:


How to add the
Cool Infographics button to your:

- iPhone
- iPad
- iPod Touch


Read on Flipboard for iPad and iPhone

Featured in the Tech & Science category

Strata Conference 2012

Follow Me!


Follow Randy (@rtkrum) 

Blog posts ONLY on Twitter

Twitter List: Cool Infographics People

Twitter Feed
Political Party Posters
2012 Death & Taxes Poster

Cool Affiliates

OmniGraffle

OmniGraffle for Mac - The Omni Group


Pixelmator

Pixelmator - Pixelmator Team


MindNode Pro

MindNode Pro - Markus Müller


 Skitch

Skitch - Skitch


GraphicConverter

GraphicConverter - Lemke Software GmbH


Visit Art.com


From the Bookstore

Caffeine Poster

Gadget Map

Google Insights

Infographics Carousel
Thanks to...
Powered by Squarespace


« The FedEx Universe | Main | Underskin: The Human Subway Map »
Friday
Mar122010

Heat: A Visual Tour of What's Hot


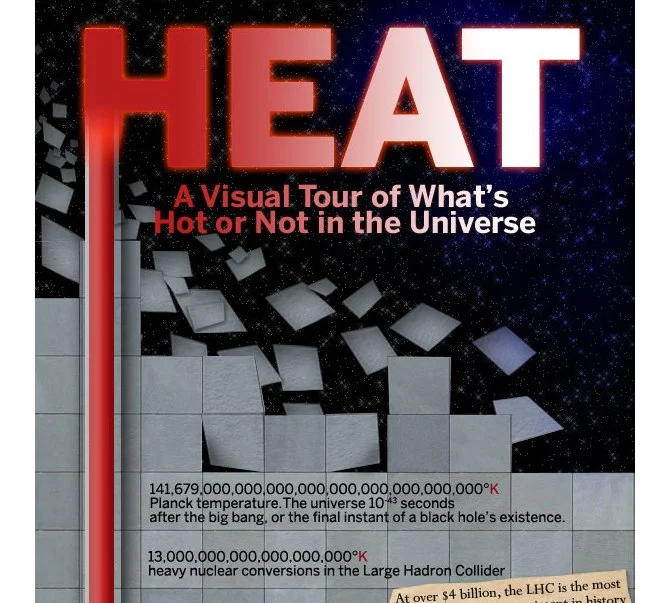
Our friend, Jess Bachman from WallStats.com, created Heat: A Visual Tour of What’s Hot or Not in the Universe for Rasmussen College.  This fun infographic lines up real-life examples across the entire scale of temperature.

I really like this one, its fun.  Basically it a huge ordered list of temperatures.  Sometimes it just helps to see everything all in one go, to add some perspective.  Also there are cool factoids and such scattered about.  To support my work please digg it and tweet it or otherwise spread the good word!  Thanks y’all.


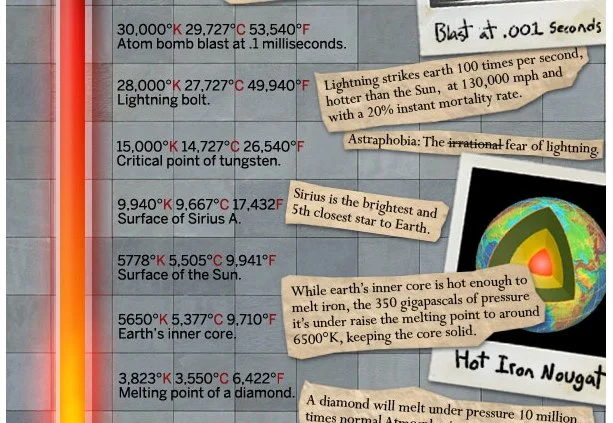
There are a few humorous entries included in the scale, like the melting point of ice cream at 5°F.  The entire infographic can be seen on the Rasmussen College website.  You can see Jess’ own comments on his blog.


Nice job Jess!

PrintView Printer Friendly Version

EmailEmail Article to Friend

Reader Comments (3)

Shouldn't the Fahrenheit temperature under "Lowest Recorded" be nagative? Looks like a typo.

March 14, 2010 | Unregistered CommenterAmbuj Saxena

Kelvins are not measured in degrees.

March 18, 2010 | Unregistered CommenterKooter

This graphic really puts into perspective where these temperatures are. The fact that a self-cleaning cylce is 900f is a little surprising.

PostPost a New Comment

Enter your information below to add a new comment.

My response is on my own website »
Author Email (optional):
Author URL (optional):
Post:
 
All HTML will be escaped. Hyperlinks will be created for URLs automatically.