Home
Infographics
Book
Tools
Tools Directory
DataViz Guides
DataViz Shows
Word Clouds
Sankey Diagrams
Online Infographics Design
Online DataViz
Analytics Platforms
Infographic Resumes
Vector Graphics
Icon Libraries
Color Pickers
Presentation Design
JavaScript Charts
Free Stock Images
Jobs
Posters
Links
Appearances
About
Contact
Follow Cool Infographics
Need Infographics?
Randy Krum
Designer | Author | Instructor | Speaker
FREE Sample Chapter
Read More
All tagged
wealth
Mar
11
Mar 11
Wealth Inequality in America
Randy Krum
Dec
8
Dec 8
Infographic Coins!
Randy Krum
Oct
7
Oct 7
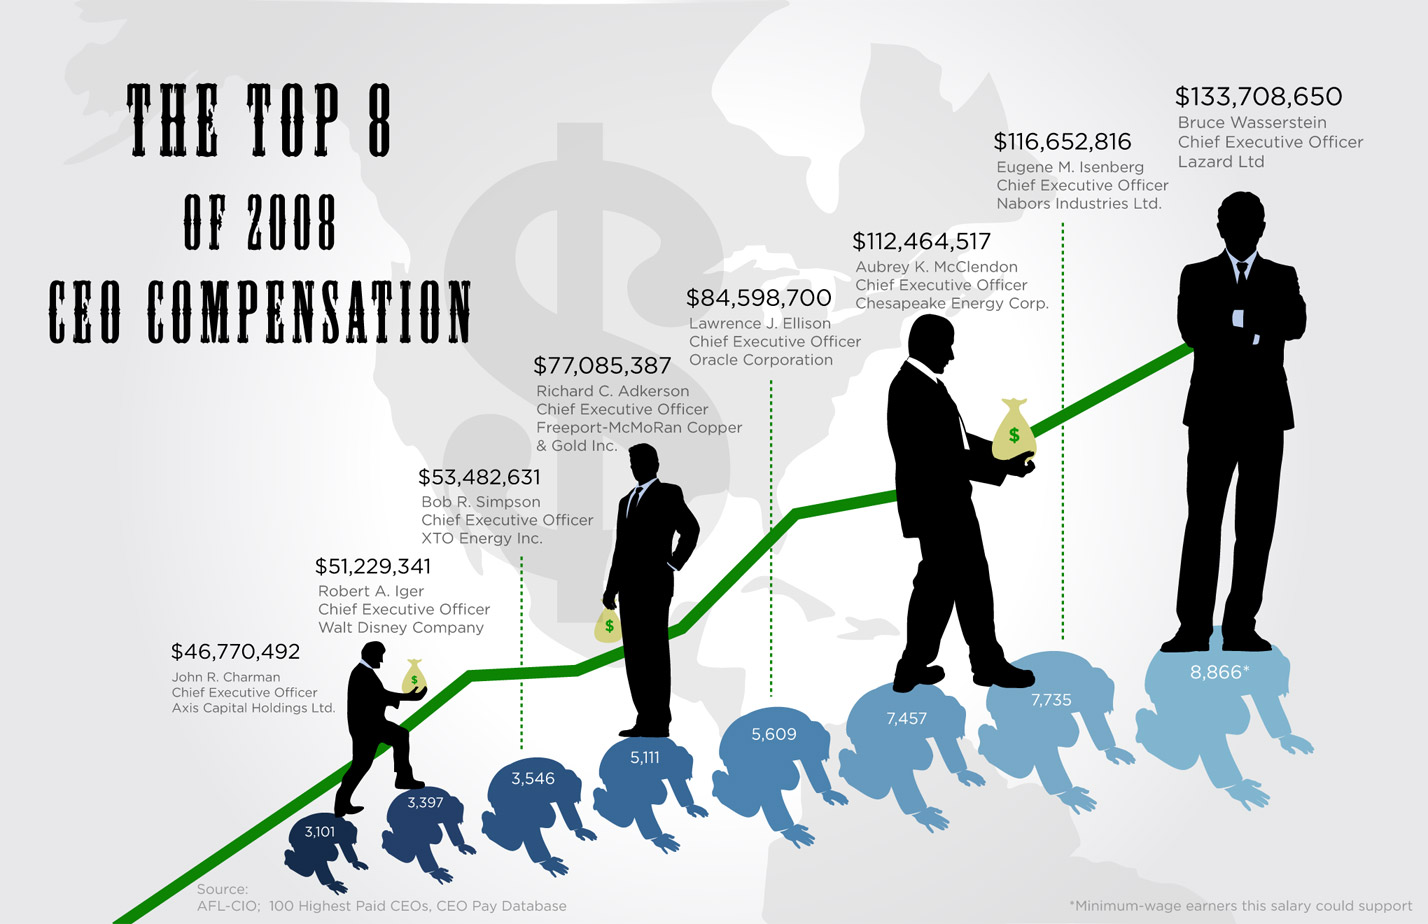
CEO Compensation Infographic Contest Winner!
Randy Krum
Sep
4
Sep 4
New Hans Rosling video, using GapMinder (Must see!)
Randy Krum
Aug
26
Aug 26
What is the GDP per Capita for Every Country?
Randy Krum
Aug
18
Aug 18
American health care on (4) napkins
Randy Krum
Aug
4
Aug 4
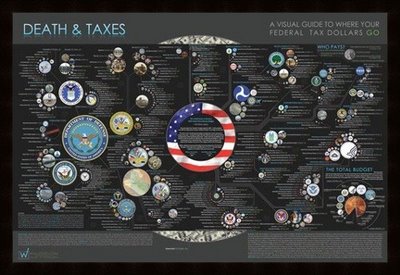
NEW Death and Taxes 2010 poster!!
Randy Krum
Jul
24
Jul 24
One Trillion Dollars Visualized [infographic video]
Randy Krum
Jul
22
Jul 22
Obama's Credit Card Statement
Randy Krum
Feb
26
Feb 26
The Crisis of Credit Visualized
Randy Krum
Dec
24
Dec 24
The Tallest Building: Burj Dubai
Randy Krum
Nov
17
Nov 17
A Visual Guide to the Financial Crisis
Randy Krum
Oct
22
Oct 22
It's the Economy, Stupid!
Randy Krum
Oct
20
Oct 20
NEW Death and Taxes 2009 poster
Randy Krum
Oct
10
Oct 10
Savings Mis-Trust video
Randy Krum
Sep
30
Sep 30
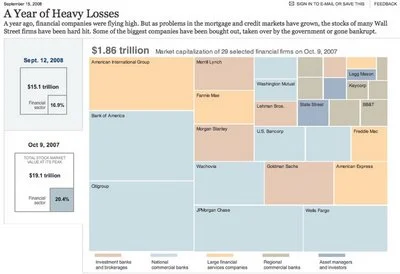
A Year of Heavy Loses
Randy Krum
Sep
22
Sep 22
Probabilistic Stock Market Forecast
Randy Krum
Aug
1
Aug 1
Small Gambling Addiction Spending Visual
Randy Krum
Jun
23
Jun 23
Obama Funding Graphic
Randy Krum
Jun
3
Jun 3
The Infographic that Saved a Million Lives
Randy Krum
Load More


![One Trillion Dollars Visualized [infographic video]](https://images.squarespace-cdn.com/content/v1/5bfc8dbab40b9d7dd9054f41/1554697540014-HGG854D6CTVZ7UAS1N7F/Screen+Shot+2019-04-07+at+10.25.07+PM.png)