Home
Infographics
Book
Tools
Tools Directory
DataViz Guides
DataViz Shows
Word Clouds
Sankey Diagrams
Online Infographics Design
Online DataViz
Analytics Platforms
Infographic Resumes
Vector Graphics
Icon Libraries
Color Pickers
Presentation Design
JavaScript Charts
Free Stock Images
Jobs
Posters
Links
Appearances
About
Contact
Follow Cool Infographics
Need Infographics?
Randy Krum
Designer | Author | Instructor | Speaker
FREE Sample Chapter
Read More
All tagged
maps
Feb
17
Feb 17
Seven Summits
Randy Krum
Jan
10
Jan 10
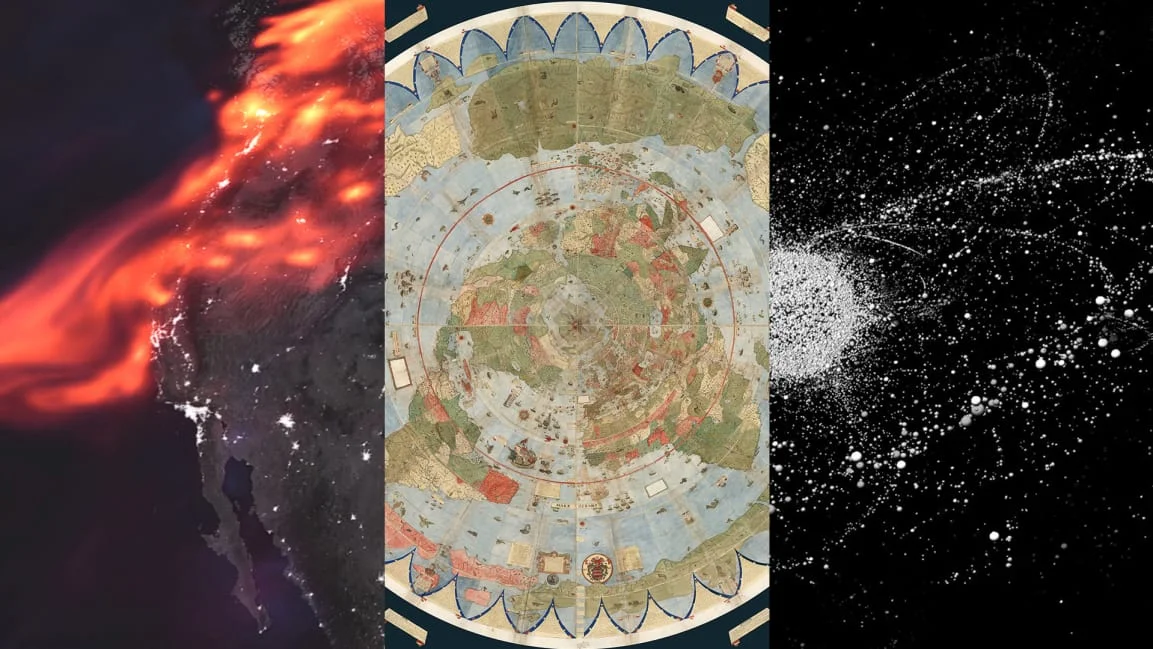
The Best DataViz of 2018 from Fast Company
Randy Krum
May
5
May 5
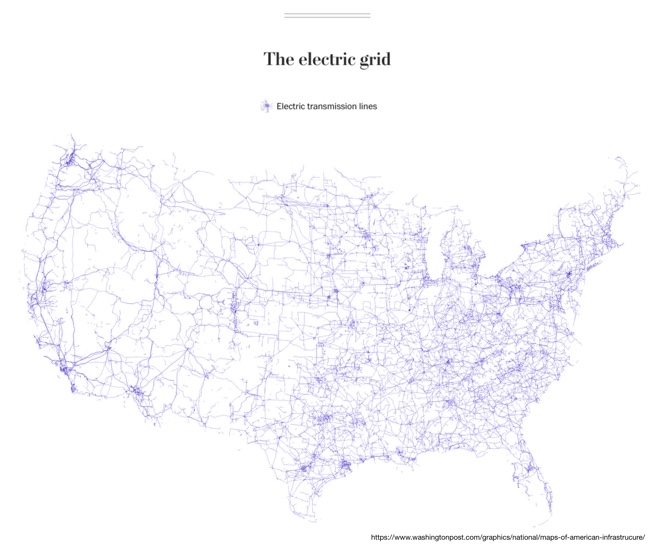
Six Maps that Show America’s Infrastructure
Randy Krum
Nov
7
Nov 7
The Most Detailed Maps from the Midterm Elections
Randy Krum
Aug
23
Aug 23
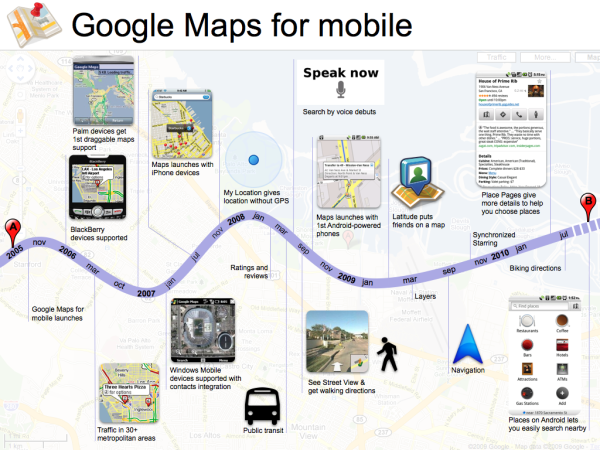
Google Maps for Mobile timeline
Randy Krum
Mar
26
Mar 26
The Best Small Cities to Buy A House (Infographic)
Randy Krum