Home
Infographics
Book
Tools
Tools Directory
DataViz Guides
DataViz Shows
Word Clouds
Sankey Diagrams
Online Infographics Design
Online DataViz
Analytics Platforms
Infographic Resumes
Vector Graphics
Icon Libraries
Color Pickers
Presentation Design
JavaScript Charts
Free Stock Images
Jobs
Posters
Links
Appearances
About
Contact
Follow Cool Infographics
Need Infographics?
Randy Krum
Designer | Author | Instructor | Speaker
FREE Sample Chapter
Read More
All tagged
live
Feb
4
Feb 4
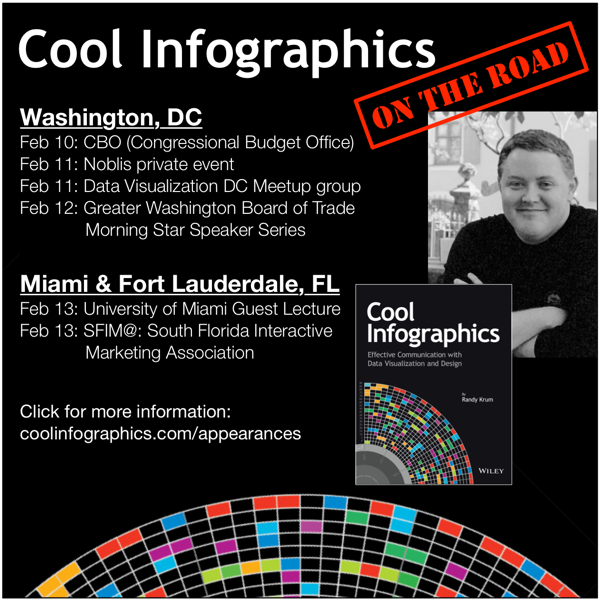
Live Events in Washington DC and Florida
Randy Krum
Oct
14
Oct 14
Infographics in the Wild - Submit your photos!
Randy Krum
Mar
20
Mar 20
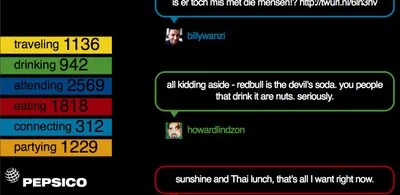
SXSW Twitter Visualizer from Pepsi
Randy Krum
Aug
28
Aug 28
VizThink Europe Discount Code!
Randy Krum
Apr
22
Apr 22
One Day Poem Pavilion
Randy Krum
Apr
14
Apr 14
Treemaps for drive space
Randy Krum
Mar
28
Mar 28
17 Ways to Visualize Twitter
Randy Krum
Jan
10
Jan 10
Digg These Pics
Randy Krum
Dec
2
Dec 2
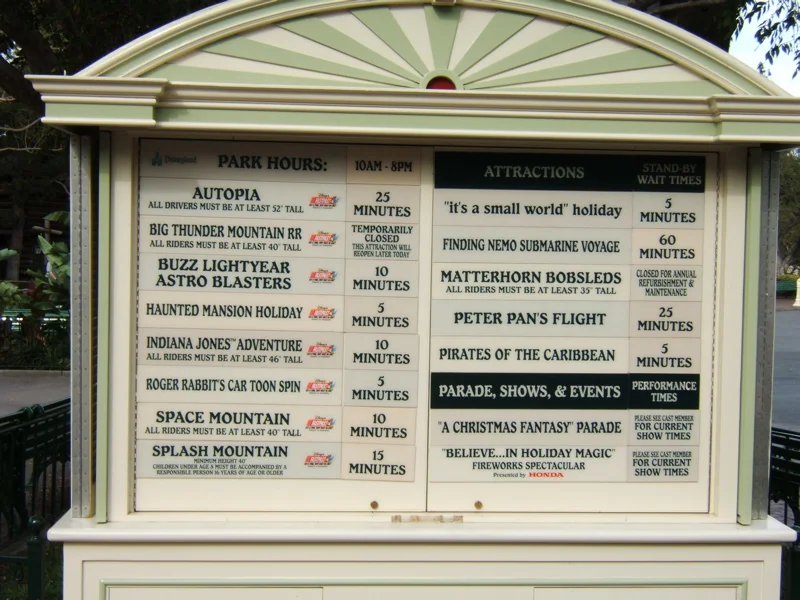
Disneyland Wait Time
Randy Krum
Nov
8
Nov 8
Flight Explorer Snapshot
Randy Krum
Oct
9
Oct 9
WiFi Detector T-Shirt
Randy Krum
Oct
4
Oct 4
Breathing Earth
Randy Krum
Sep
18
Sep 18
Speedtest.net
Randy Krum
Sep
10
Sep 10
The Bloomberg Makeover
Randy Krum
Sep
5
Sep 5
Marumushi News Map
Randy Krum
Sep
4
Sep 4
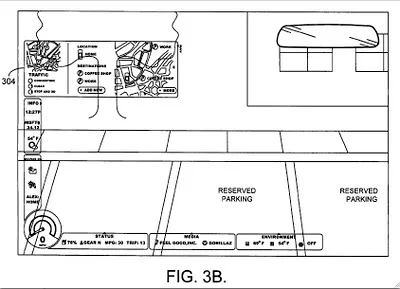
Microsoft Car HUD
Randy Krum
Sep
3
Sep 3
VizThink Conference 2008
Randy Krum
Sep
2
Sep 2
World Clock Counter
Randy Krum
Sep
2
Sep 2
Visual Tire Pressure
Randy Krum
Aug
8
Aug 8
2008 Presidential Campaign Finances
Randy Krum
Load More