Visualizing how Fans Rated the Last Season of Game of Thrones
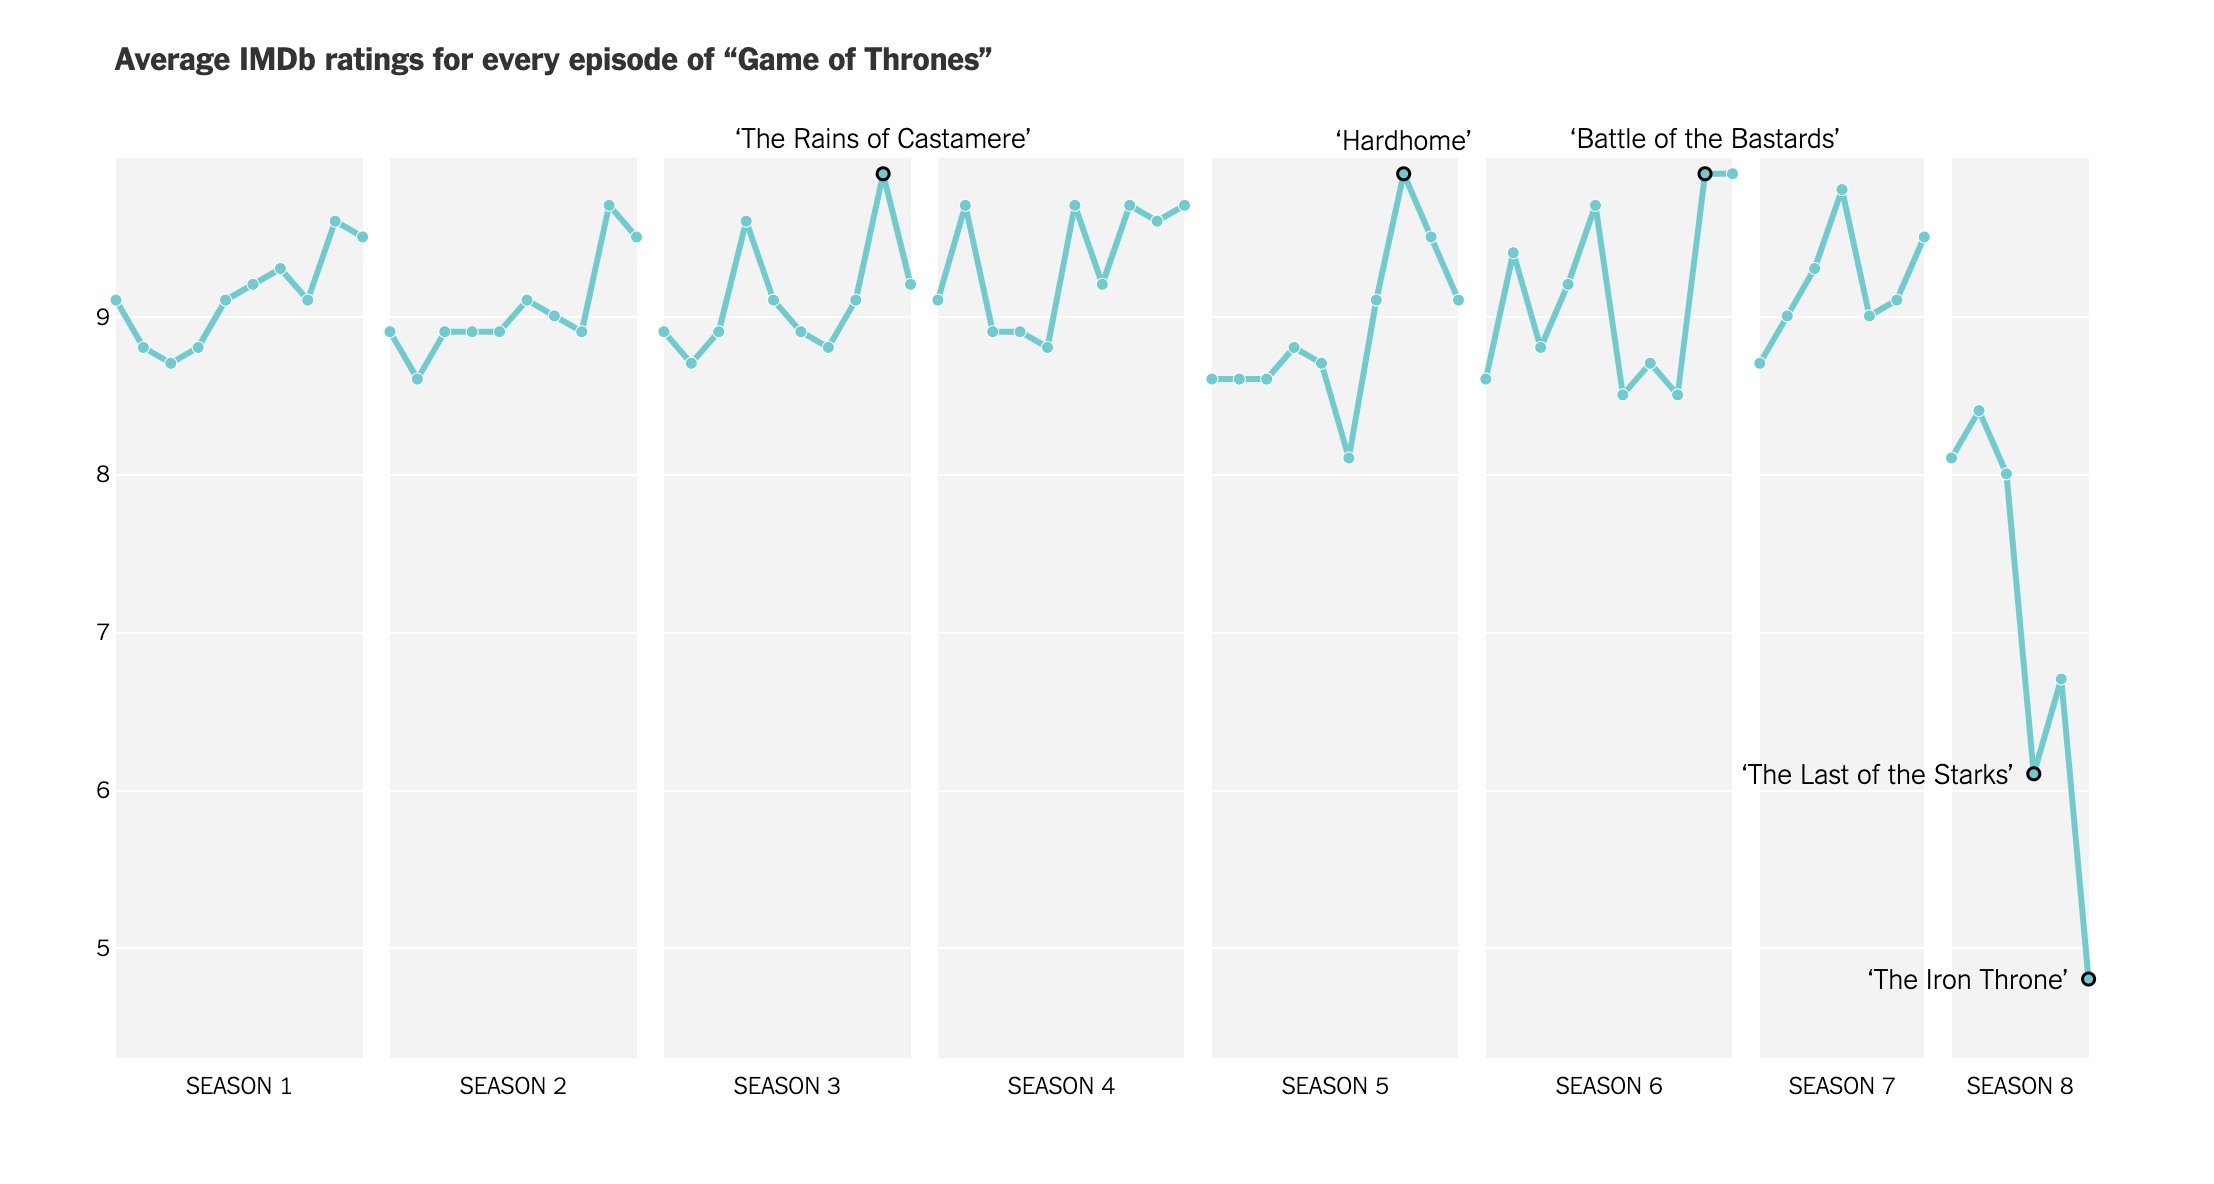
Fans have not reacted well to the final season of Game of Thrones, and The New York Times has visualized the fans disappointment by charting the average user ratings on IMDb for every episode of the eight-year run. You can see above How Fans Rated the Last Episode of Game of Thrones as the worst episode of the entire series.
The data is questionable, since the ratings are mostly upset fans taking to IMDB to share their dislike. Fans never like to see their favorite shows come to an end, but the NY Times also reached into the data for other long running TV series to see how their final seasons fared.
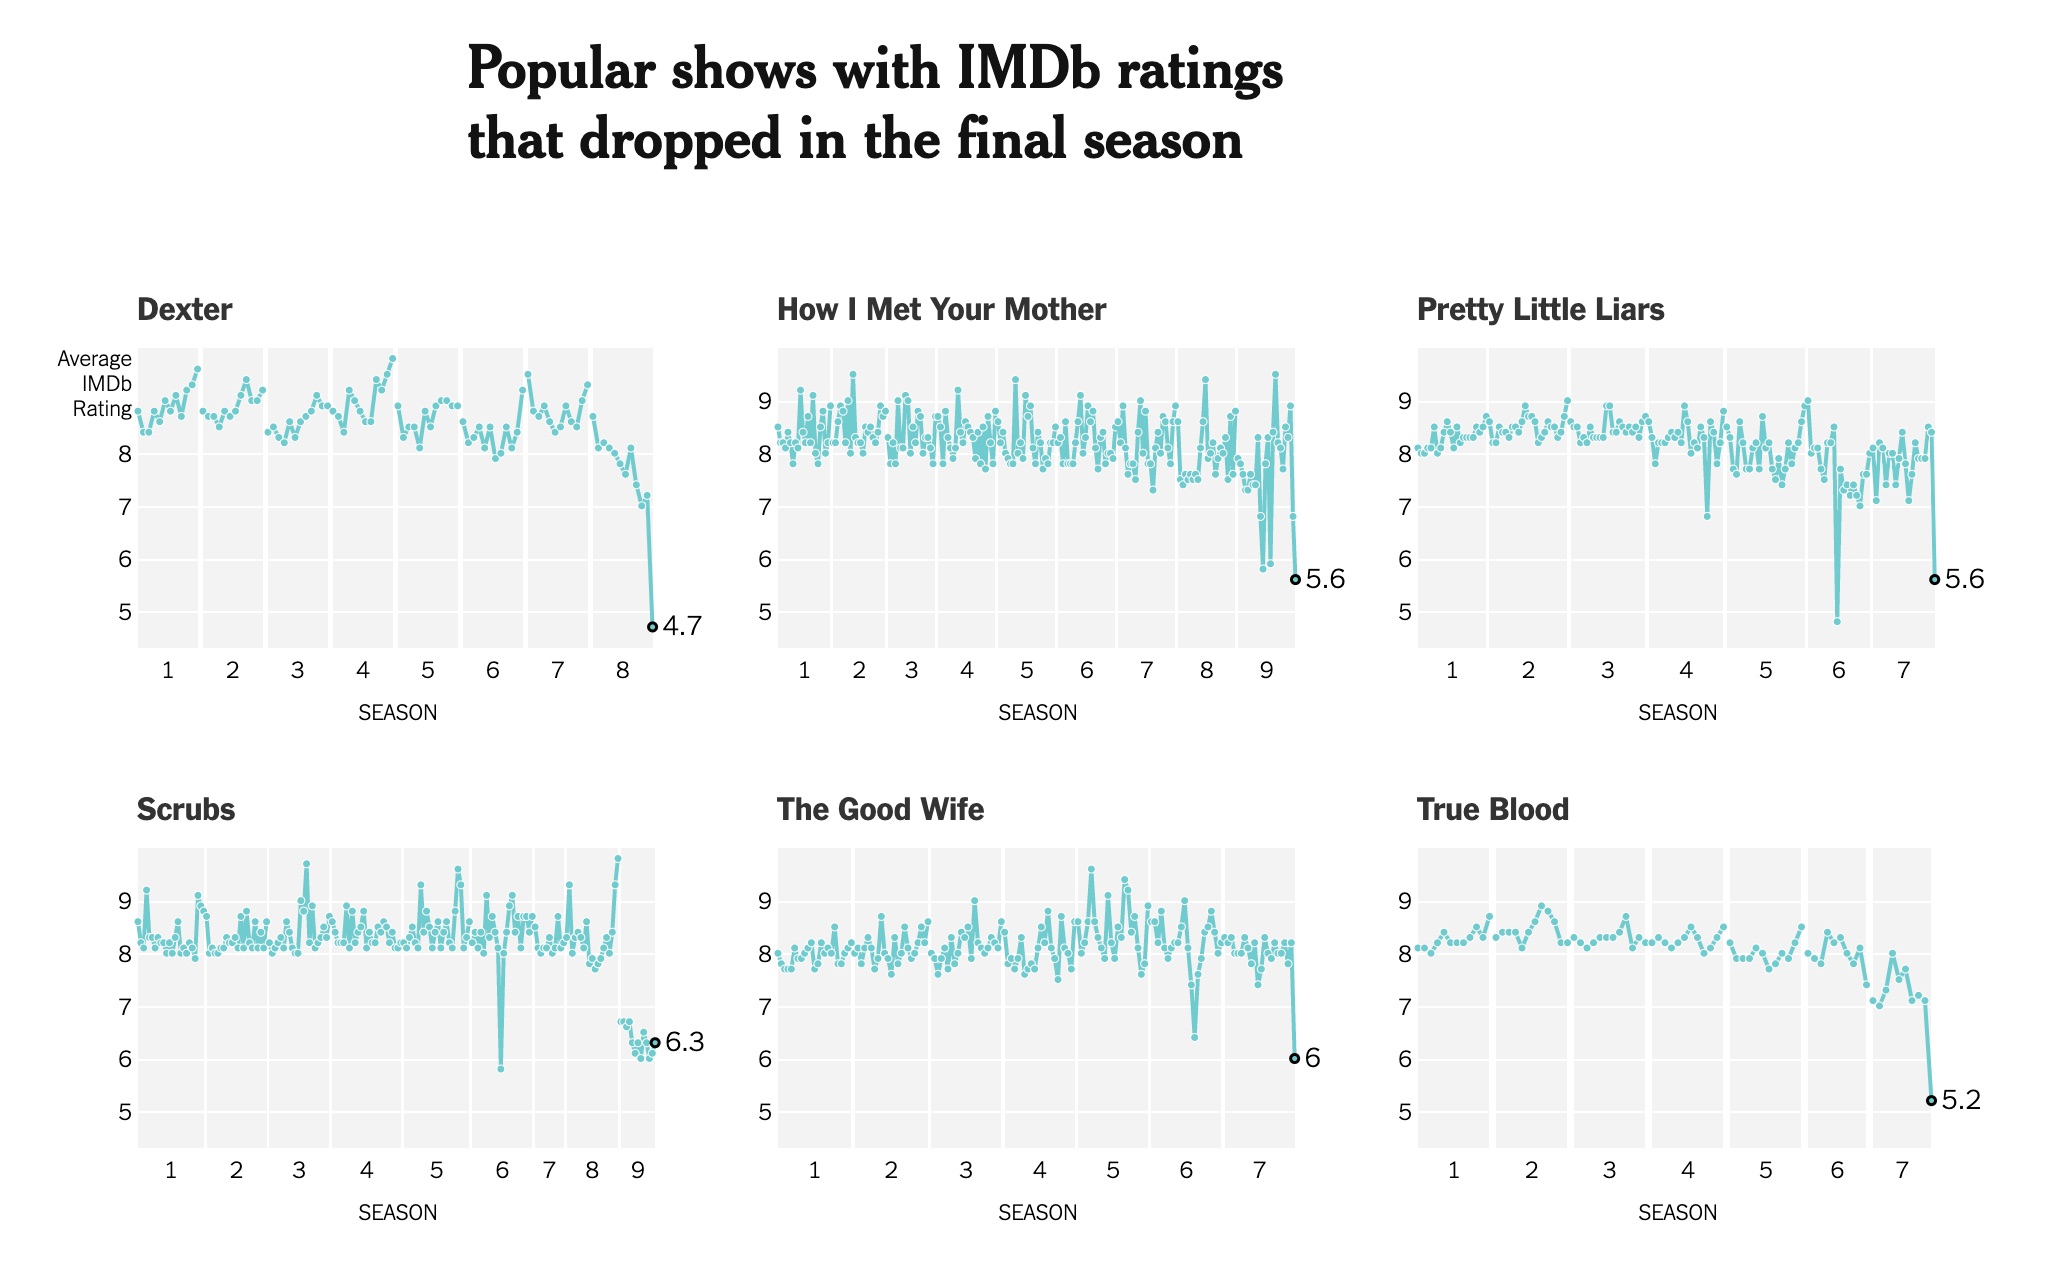
Here are a few other popular shows they found that also dropped significantly in their final seasons:
However, they were also able to find other popular shows with fan ratings at their highest during the final season or even the series finale:

These well-designed line charts do a great job of quickly showing the reader the over all trend, and any outliers (high or low).
My only hesitation with the choices they made when designing these charts is the y-axis. I appreciate that they kept the scale consistent throughout all of the charts in the article, but the non-zero baseline starting at 4.5 is an odd choice. Non-zero baselines are generally a poor design practice, and can mislead viewers that aren’t paying close attention. It looks like using a non-zero baseline was chosen to maximize the visible differences between the ratings, but on a 0-10 scale, it wouldn’t have been much different with a true zero-baseline.
Also, the decision specifically for 4.5 appears to be driven by the show Dexter, which has the lowest rated episode at 4.7. The choice of 4.5 as the baseline allows all of the data to be viewable within the scale.