Visme 3.0 Design Platform Launches Improved User Interface

Visme is an online design platform, and can be used to create infographics, presentations, banners, reports, and even resumes. With over 200,000 users, Visme is being used by many as a replacement for expensive desktop applications like Microsoft PowerPoint and Adobe Illustrator.
"Visme epitomizes everything we strive for. At the core we are a visualization tool and our mission is to simplify the ability for anyone to easily transform their thoughts and ideas into engaging visual content," - Founder Payman Taei
In April 2015, the team at Hindsite Interactive launched Visme 3.0, a complete redesign, moving to a cleaner, easy-to-use user interface. The redesign has made a major move towards flatter design elements that help users focus on the content they are creating without being distracted by the interface tools.

If you’re not a professional designer that can invest in a high-end hardware and software setup or don’t have the time or budget to hire a professional, Visme is a great platform to create eye-catching visual content with minimal effort. You can start with one of the many professional templates, and then customize your design by changing colors, rearranging the layout, uploading your own images, inserting video, building simple data visualizations using the Graph Tool, or use any of the millions of free icons and images from the huge built-in library.
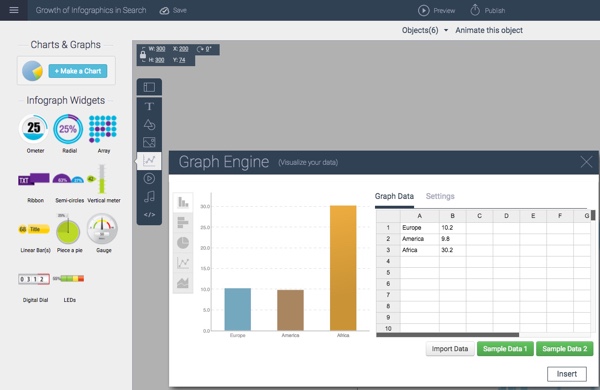
Specifically for infographics design, the built-in Graph Tool and Infograph Widgets can be very helpful. Although you may import more complex data visualizations created elsewhere, the Graph Tool let’s you build simple charts directly in your design by entering the data and editing the chart settings. This is a huge advantage over many other online design tools that only provide chart shapes and objects that you have to adjust manually to match your data. Accuracy of your data visualizations in an infographic is crucial!
Here you can see a simple area chart created with the Visme Graph Tool. Over 600 data points were uploaded to create this simple data visualization. Because it was built with the Graph Tool, the chart is editable as the data set continues to grow in the future. The design has been inserted here using the embed code created by the Visme platform to display the chart. As future updates are made to the chart on the Visme site, the most current version will always be displayed here. For infographics, you can update the data in your design, and every site that uses the embed code will always display the latest version of your design.
Original: http://my.visme.co/projects/growth-of-infographics-in-search-613ce1
Personally, I’d like to see the Graph Tool expand into more visualization styles, and give the users more ability to customize the charts it creates. It’s pretty good with the simple charts, but I hope this is only the starting point for the Visme team. I hear that improvements to the Graph Tool are in the plan for release later this year.
Infographics are made to be shared, and the Visme tool gives you plenty of options. In addition to embed code for both animated and static sharing, you can also download your design as a static image file (JPG or PNG) or a PDF file for easy distribution. You can also download as HTML5 version which would retain all interactivity of your live version and open locally in any browser without third party software or plugins.
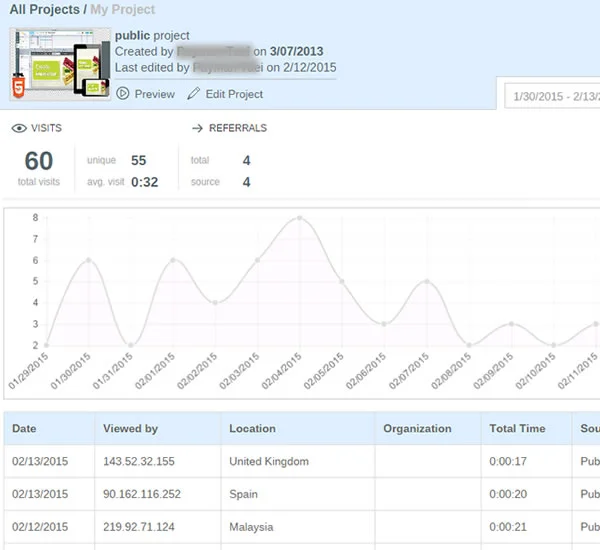
Two other advantages of designing your infographics in Visme. First, you can keep your designs private, and only allow those that have the link to view your design. You can even password protect your design so only those with the link and the password can view your design. Second, you can see the analytics for your design in one place. This is a real challenge for tracking infographics online, and seeing the combined statistics of views and visits to your infographic is a fantastic feature. For everyone that shares your infographic on their own using the embed code, those viewer statistics are all gathered together in your Visme analytics dashboard.
Visme is free to everyone to try with many of the basic design tools. Paid plans start at just $6/month to unlock premium templates, along with the ability to manage privacy, download content, analytics and collaboration tools.
Special for readers of Cool Infographics, use the discount code VISME3 to get a lifetime 25% discount on any subscription.