PepsiCo Q2 2013 Performance Infographics
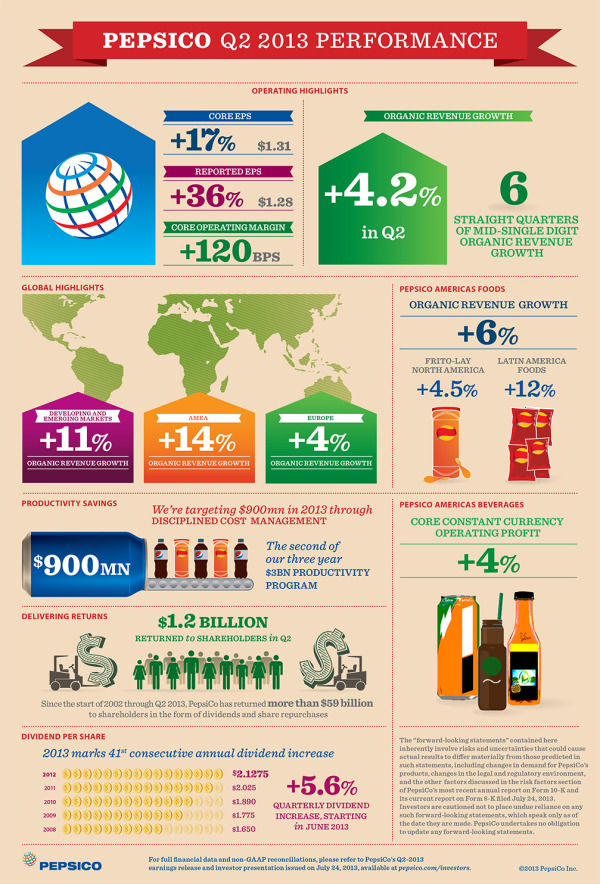
PepsiCo has begun to publish an official infographic along with each of their quarterly earnings reports to investors and analysts. The PepsiCo Q2 2013 Performance infographic was just released online to coincide with the press release and earning call to analysts.
I love seeing infographics used in this way, and I think we will be seeing many more of them from other companies. Visualizaing the financial data can make the complex filings much easier for investors to understand.
As much as I love this idea, this particular design needs help visualizing the data. Big fonts are not data visualizations, and many of the financial stististics presented were shown in text only. It takes a data visualization to put the values into perspective for the audience, and make them easier to understand.
This is the second infographic in the series. It appears that each one will be released with a unique website dedicated to hosting the infographic. This on can be found at: www.pepsicoinfographicq2.com, and a PDF version is also available to download from the site. You can find the infographic from the prior qurter here: www.pepsicoinfographicq1.com. The infographics were also published on the PepsiCo Multimedia Downloads section of the Media page.
Thanks to Chris Hoyt for posting on Google+