![What BP Could Have Bought With All the Money They Lost [infographic]](https://images.squarespace-cdn.com/content/v1/5bfc8dbab40b9d7dd9054f41/1553650333996-YG67KU8EHVRVF4A8MSUR/What%2BBP%2BCould%2BHave%2BBought%2BWith%2BAll%2Bthe%2BMoney%2BThey%2BLost%2B.jpg)
What BP Could Have Bought With All the Money They Lost [infographic]
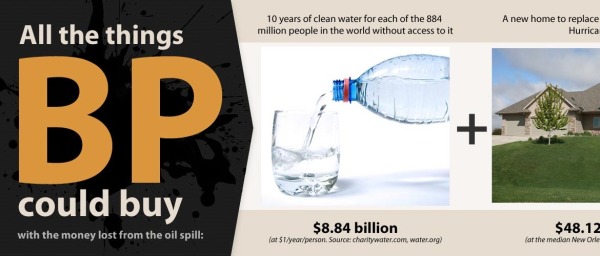
From VisualEconomics.com “What BP Could Have Bought With All the Money They Lost” is a long, side-scrolling visual of some examples of what BP could have done with $100,000,000,000. I like the use of photos to help tell the story, and it stands out from the crowd by scrolling to the side instead of down.
Two things I think are wrong about this one though. Although all of the possible expenditures add up, the number values aren’t visualized in any way. Also the $100,000,000,000 is the loss in stock market capitalization, not $3.5B in cash that BP has spent on recovery efforts. It’s not actually money that BP has spent.

![Win Rock Paper Scissors Every Time [infographic]](https://images.squarespace-cdn.com/content/v1/5bfc8dbab40b9d7dd9054f41/1553651195179-Q0NHFZYSW72X96JPLQ0V/rock-paper-scissors-medium.jpg)