Ecological Footprint from Digital Eskimo
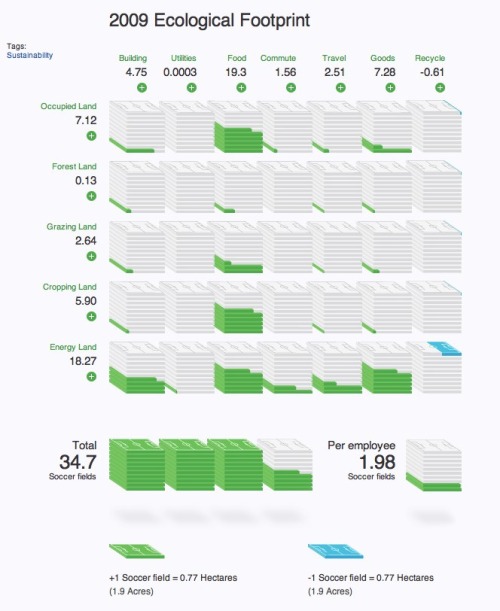
In their interactive 2009 Ecological Footprint infographic report, Digital Eskimo has used the analogy of the football field (soccer field in America) to visualize their impact because global hectares (the standard units of ecofootprint measurement) aren’t easy to conceptualize.
I love that the team at Digital Eskimo is not only using this infographic to share results and information within the company, but also sharing it publicly to demonstrate their commitment to working on projects that inspire positive social, organisational and environmental change. Infographics are a VERY powerful tool for communicating clear messages within your company, even if you never share it with the outside world.
Digital Eskimo has always worked very hard to minimise our impact on the environment. In order to help us better understand these impacts, and develop more effective strategies to address them, we calculated our ecological footprint for the 2009 financial year.
Ecological footprinting is one way of measuring whether the way in which we operate is sustainable in a global context. We chose this method because it is widely used, it provides results in an understandable format while clearly showing relative impacts of different elements of our operations.
Thanks to Sally for the link and a description of how Digital Eskimo is walking the talk.
![The Top Cameras on Flickr [infographic]](https://images.squarespace-cdn.com/content/v1/5bfc8dbab40b9d7dd9054f41/1554051709126-EYZW4CGMPIXUFY2KR1M8/SF-FLICKR-CAMERAS.png)